Home Blog Page 123

Cardano Holds Long-Term Support as Whales Control 67% of ADA Supply, Hinting at Bigger Move Ahead

Cardano (ADA) is currently showing a structure that has traders watching closely.

Community figure Evans noted that ADA is still holding the same key support zone it defended during the previous bear market cycle.

Despite multiple swings over the years, the price continues to respect a long-term support area while facing a downward resistance trend. Such a structure builds pressure in the market, especially when prices compress between support and resistance for a long time.

At the moment, ADA is trading around $0.2527, down about 5.24% in the last 24 hours but still up roughly 2% over the past month.

Key Points

  • Cardano holds long-term support as price compresses between resistance and key demand zones.
  • Whales now control over 67% of ADA supply, showing continued accumulation despite recent price weakness.
  • Analysts say ADA may be entering a breakout phase, with targets ranging from $0.33 to as high as $4.
  • However, the bullish outlook depends on ADA holding $0.25 and broader Bitcoin market strength.

Whales Continue Steady ADA Accumulation

On-chain data from Santiment shows a strong trend beneath the price action. Large holders are not reducing exposure. Instead, they are slowly increasing it. According to Santiment Intelligence:

  • Wallets holding more than 1 million ADA now control over 25 billion ADA on average
  • This represents 67.47% of the total supply
  • This is the highest concentration since July 2020
  • Accumulation has been building steadily since December 2023
  • Even after a 71% drop in market cap over nine months, large holders continue adding

This suggests that while retail sentiment may appear uncertain, bigger players are positioning at lower price levels.

Image

Cardano Market Snapshot Shows Compression Phase

The chart shared alongside the data highlights a long-term resistance trend gradually pushing the price downward, while a support trend holds firm underneath.

This creates a tightening structure where ADA has repeatedly bounced from similar levels across multiple cycles. The current price region sits close to the lower boundary of this range, where buyers have historically stepped in.

When prices compress like this for an extended period, the market often enters a phase where momentum builds quickly once a breakout occurs, either upward or downward.

Image

More Analysts Call for an ADA Bull Run

Many other market watchers are now pointing to a similar structure and projecting promising outlooks. In a recent update, analyst Ali Martinez noted that Cardano may enter a new bull phase after the SuperTrend indicator flashed a fresh buy signal on ADA’s daily chart.

Martinez noted that the same indicator correctly signaled a sell in September 2025 before ADA plunged 73%. He believes the correction phase may be ending, with ADA now targeting $0.33 and potentially $0.42 if bullish momentum continues.

However, he stressed that Cardano must hold above the $0.25 support level to maintain the bullish setup.

Separately, analyst Celal Kucuker said Cardano has one of the cleanest bullish chart setups in the current market cycle, projecting a rally toward $4.

Kucuker highlighted ADA’s long-term rounded base formation, suggesting that a breakout above the key $1 resistance could trigger a move toward $4.21. From its current price, that would represent a gain of nearly 1,400% and push Cardano above its 2021 all-time high.

In summary, the combination of whale accumulation and long-term support holding gives ADA a promising setup, according to multiple analysts.

However, the potential move will still depend on the overall market, particularly a broader Bitcoin bull run.

“XRP Will Melt Faces,” Analyst Points to $3.6B XRPL RWA Boom and $10 Target

XRP community educator X Finance Bull recently argued that the market may still be underestimating XRP’s long-term potential.

He based this view on the XRP Ledger’s growing role in the real-world asset (RWA) sector as tokenized finance continues to expand.

In a recent post on X, the analyst pointed to data from RWA.xyz showing that the XRP Ledger climbed 63% over the last 30 days on the platform’s RWA league table.

According to the analyst, the XRPL has absorbed more than $3.6 billion in tokenized real-world asset value in just five months. The comment has fueled speculation that XRP’s price could eventually reach double digits if adoption continues to accelerate.

Key Points

  • XRPL’s tokenized RWA value topped $3.6B in months, fueling fresh bullish sentiment around XRP.
  • Analyst says XRPL’s rapid RWA growth could push XRP toward $10 as institutional adoption expands.
  • Tokenized U.S. Treasuries on XRPL surged 8x to $418M as firms increase blockchain adoption.
  • XRP supporters compare today’s skepticism to early Bitcoin doubts before BTC’s historic price rally.

XRPL’s RWA Growth Gains Attention

The analyst claimed the rapid rise of tokenized assets on XRPL shows that institutional adoption is beginning to take shape.

Real-world assets are traditional financial products such as bonds, funds, real estate, and commodities represented on blockchain networks. Supporters of XRP believe this sector could become one of crypto’s largest growth areas over the next decade.

The commentator said XRPL is getting closer to overtaking BNB in the RWA rankings as Ripple and the XRPL Foundation continue efforts to bring traditional finance on-chain.

The analyst also suggested that trillions of dollars could eventually be tokenized on the XRP Ledger, which would significantly affect XRP’s valuation.

Notably, the crypto tokenized asset market is worth over $350 billion, while XRPL remains far lower at $3.6 billion.

Comparisons to Bitcoin’s Early Skepticism

Meanwhile, to support the bullish outlook, the XRP supporter compared today’s criticism of XRP to the skepticism Bitcoin faced during its early years.

According to the post, critics once argued Bitcoin would never surpass $100 back in 2011. The analyst noted that Bitcoin later surged to an all-time high near $126,000 in October 2025, proving many early doubters wrong.

The comparison was used to argue that current doubts about XRP reaching $10 may eventually fade if adoption continues to grow.

“We will see. XRP will melt faces,” the analyst wrote. The comment suggests that the current price may still be far below where the asset could trade in the future.

Tokenized US Treasuries on XRP Ledger Jump 8x

The latest comments add to the optimism within the XRP community surrounding the role of the XRP Ledger in tokenized finance. Several market participants believe that expanding RWA products on XRPL could strengthen demand for XRP over time.

In April, data from Evernorth showed tokenized U.S. Treasuries on XRPL surged from $50 million last year to $418 million, marking an 8x increase.

Platforms including OpenEden, Ondo Finance, and Zeconomy are driving Treasury tokenization on the network. The growth suggests institutions are increasingly using XRPL to move traditional financial assets on-chain.

XRP Ledger Tokenized value |https://app.rwa.xyz/networks/xrp-ledger

According to Evernorth, rising issuance and transfer activity indicate institutions are actively testing XRPL as a scalable settlement and distribution rail for tokenized assets.

New Wallet Goes Long on 20M Dogecoin With 10x Leverage

A newly created crypto wallet has opened a highly leveraged position on Dogecoin, placing a 10x long bet on 20 million DOGE.

Popular blockchain analytics platform Lookonchain drew public attention to the transaction, which was opened late yesterday. The trade quickly sparked discussions due to its massive size, high leverage, and tight liquidation range. Consequently, many traders viewed it as a strong bullish bet despite Dogecoin’s ongoing volatility.

Key Points

  • A newly created crypto wallet opened a 10x leveraged long position on Dogecoin.
  • The position involves 20 million DOGE valued at approximately $2.25 million.
  • With DOGE plunging to $0.11, the position now faces an unrealized loss of about $60.000. 
  • The market downturn has triggered roughly $575 million in crypto liquidations, including about $9.55 million tied to leveraged Dogecoin positions. 

New Wallet Opens 10x Leverage on 20M DOGE 

According to Lookonchain data, the newly created wallet opened the leveraged Dogecoin position with 10x leverage on 20 million DOGE valued at approximately $2.25 million.

The trader entered the position at $0.11335. However, the screenshot shared alongside the report showed DOGE trading at $0.11273, leaving the position with an unrealized loss of about $12,410. 

Image

At press time, DOGE extended its decline to $0.11027, widening unrealized losses to roughly $60,724. Despite the pullback, the trader has maintained the 10x leveraged position. Meanwhile, the liquidation price remains fixed at $0.10284. If DOGE falls to that level, the trading platform will automatically close the trade to limit further losses. 

Dogecoin Enthusiasts React 

The trade has triggered widespread reactions across the crypto community, largely because the wallet was newly created and the trader used aggressive leverage. As a result, some DOGE enthusiasts speculate that the trader could be a high-risk “degen” investor or someone anticipating a major bullish catalyst for Dogecoin.

In addition, the liquidation price, sitting roughly 9% below the entry level, has fueled further debate. Many traders argue that the narrow liquidation gap highlights the trader’s strong conviction in a potential upward move. 

Over $570M Leveraged Bets Erased 

Meanwhile, the position comes amid renewed selling pressure in the broader crypto market. Over the past 24 hours, Bitcoin, Ethereum, BNB, and XRP have declined by 2.75%, 2.76%, 3.60%, and 3.72%, respectively. Dogecoin has also suffered in the broader market downturn, dropping 4.24% during the same period. The latest correction has triggered approximately $575 million in crypto liquidations over the past 24 hours, with long positions accounting for $549 million of the total. 

Bitcoin and Ethereum traders recorded liquidations of $188 million and $151 million, respectively. Meanwhile, leveraged Dogecoin positions contributed roughly $9.55 million to the overall liquidation figure.

Total Crypto Liquidation

XRP Has the Potential to Outperform Bitcoin by 10x: Here’s How

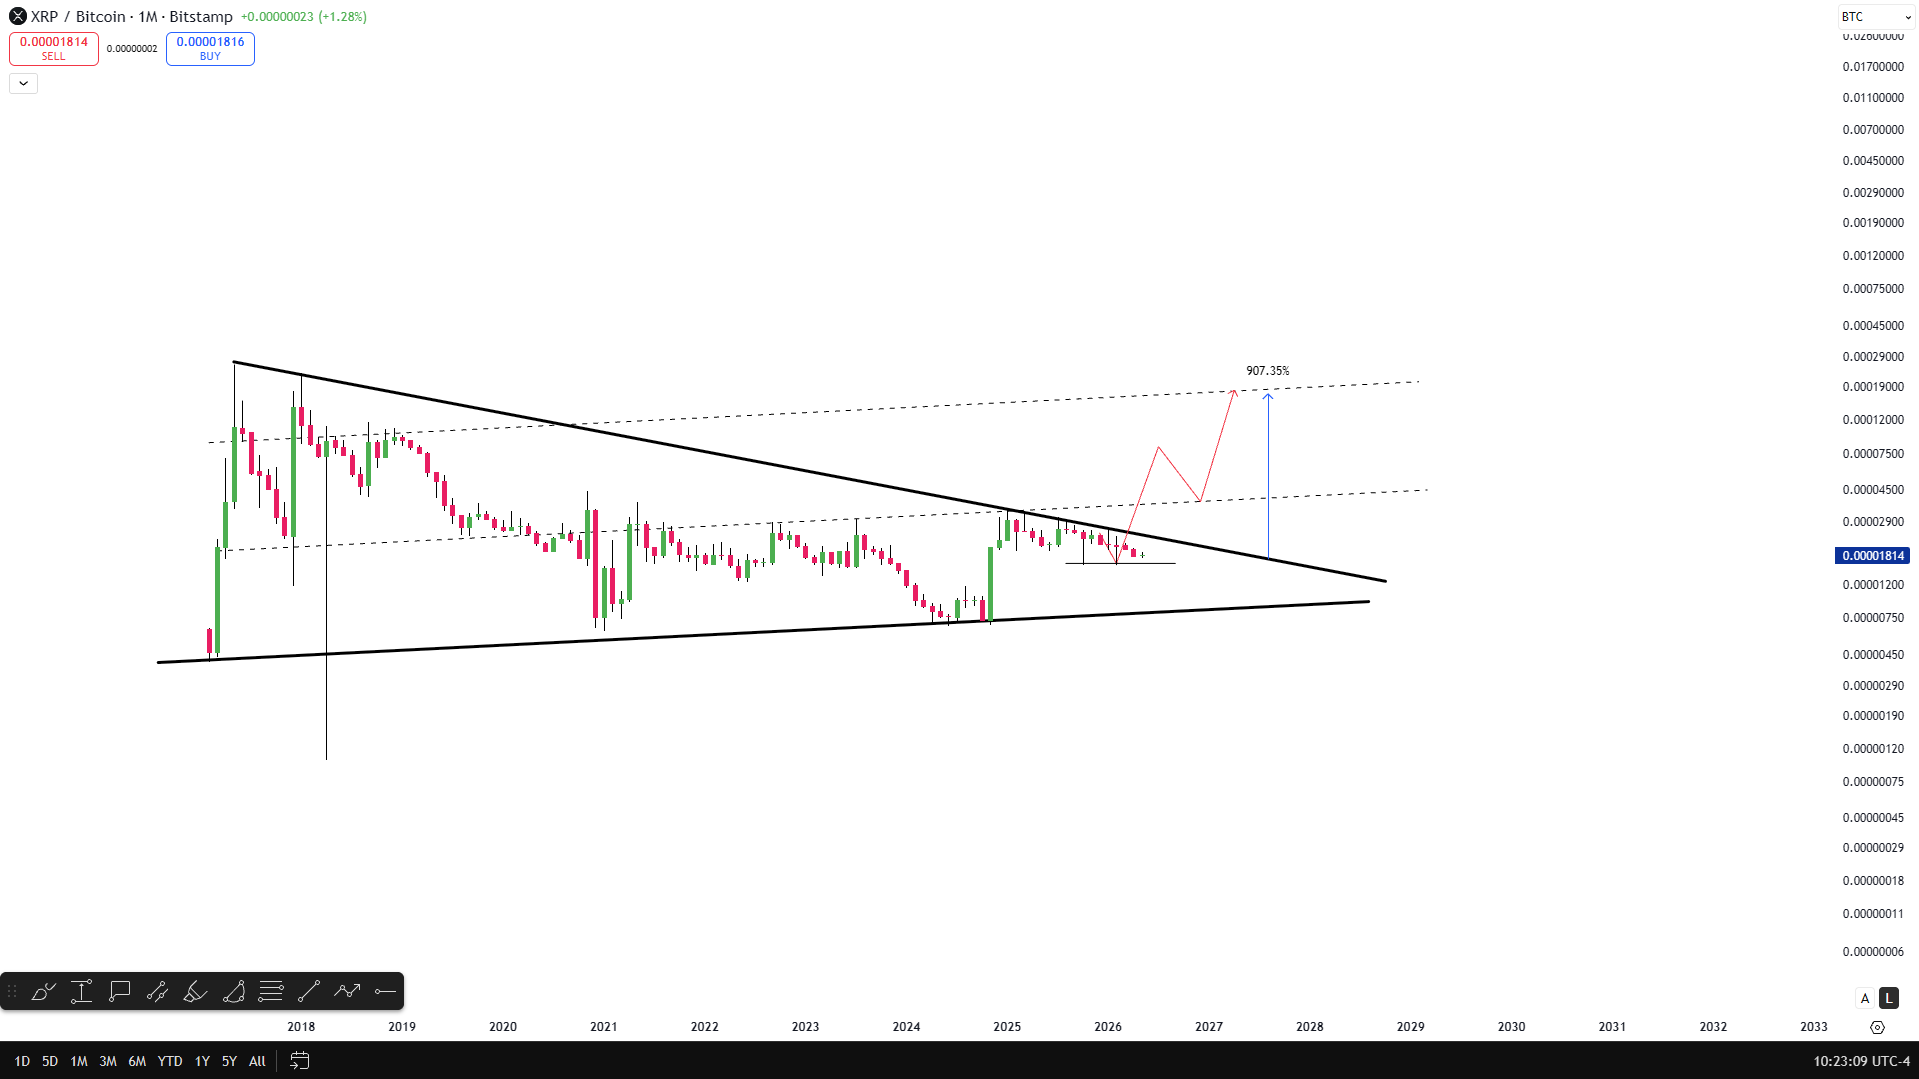
XRP has the potential to outperform Bitcoin by 10x if it can break above the upper trendline of a multi-year symmetrical triangle.

XRP has dropped 41% against Bitcoin since its $3.6 peak in July 2025, but continues trading within a long-term symmetrical triangle, which could precede a major breakout and strong relative performance.

Market analyst Celal Küçüker believes XRP could outperform Bitcoin by up to 10x if it breaks out, projecting a potential move toward $15.

Key Points

  • XRP has declined 41% against Bitcoin since reaching its $3.6 all-time high in July 2025.
  • The XRP/BTC pair has traded within a symmetrical triangle on the monthly timeframe since 2018.
  • Küçüker says XRP could outperform Bitcoin by 10x and enter a parabolic move.
  • He warns that traders may sell early after a 3x move, missing most of the upside potential.
  • A breakout could trigger a 907% surge against Bitcoin and push XRP above $15.

XRP Could Outperform Bitcoin by 10x

According to Küçüker’s analysis, XRP could be on the verge of a major move that would allow it to outperform Bitcoin substantially if it successfully breaks out of the long-standing symmetrical triangle.

Küçüker maintains a highly optimistic stance on XRP’s trajectory against Bitcoin, asserting that the asset has the potential to deliver a 10x outperformance relative to BTC. He emphasized that the chart structure appears extremely clear, confirming his conviction.

The market analyst explained that XRP seems poised to enter a parabolic phase on the daily timeframe, suggesting that price acceleration could happen quickly. Notably, multiple market participants expect a correction, but Küçüker believes the opposite will occur.

Speaking further, he argued that early gains could mislead traders. According to him, a 3x price increase may cause many investors to exit prematurely, believing the asset has become overextended. 

However, he suggested that the most substantial gains would likely begin after such exits. To him, a large portion of market participants may close their positions before even capturing 10% of XRP’s full upside potential. 

Notably, if momentum builds as expected, the market technician projects that XRP could surge above $15 in a relatively short time frame, catching many off guard.

The XRP/BTC Symmetrical Triangle

Data from Küçüker’s chart confirms that the XRP/BTC pair has traded within a symmetrical triangle on the 1-month timeframe since 2018, indicating a prolonged consolidation phase.

XRP Symmetrical Triangle Against Bitcoin Celal Kucuker
XRP Symmetrical Triangle Against Bitcoin | Celal Kucuker

XRP reached a major peak in January 2018, when its price climbed to $3.3, pushing the XRP/BTC pair to 0.00023, one of its highest recorded levels. Following this peak, XRP experienced a substantial decline, which led to a downtrend against Bitcoin.

This decline led to the current triangle pattern, featuring lower highs and gradually rising lows over several years. The compression suggests that volatility has tightened, increasing the likelihood of a decisive breakout.

Key XRP Support Levels and Breakout Potential

The chart also shows a major horizontal support level at 0.00001575, which has helped maintain XRP’s structure against Bitcoin. The pair tested this support in October 2025 and quickly rebounded, confirming the resilience at this level.

Currently, XRP/BTC trades around 0.00001808, while XRP itself changes hands at approximately $1.41. Despite the broader decline since the $3.6 peak in July 2025, the pair has consistently held above this key support.

If this support continues to hold, it could provide the foundation needed for XRP to break above the upper boundary of the symmetrical triangle. Küçüker’s chart projects that such a breakout could trigger a 907% surge in XRP relative to Bitcoin.

XRP Up 24,000% in 10 Yrs, Beats Bitcoin, Gold, Tesla, Apple

Supporters of XRP are once again pointing to its long-term performance compared to Bitcoin and traditional stocks. 

In a tweet, lawyer and XRP advocate Bill Morgan argued that the token has outperformed major assets over the last decade by an extraordinary margin.

Notably, the debate started after Bitcoin Magazine shared a comparison of asset returns over the past 10 years. According to the post, Bitcoin gained 17,240% since 2016.

Meanwhile, during the same time, Tesla rose 3,122%, Apple climbed 1,355%, Google advanced 1,015%, Amazon gained 654%, the S&P 500 rose 323%, and Gold increased 255%.

Morgan responded by saying XRP outperformed them all during the same period, citing up to 24,000% gains.

Key Points

  • XRP gained nearly 24,000% in 10 years, outperforming Bitcoin, Tesla, Apple, Gold, and the S&P 500.
  • Bitcoin rose about 17,300% since 2016, while XRP climbed from $0.006 to around $1.42 today.
  • Critics say XRP’s gains depend on a selective timeframe, as the token remains below its 2018 peak.
  • The debate highlights Bitcoin’s steady growth versus XRP’s higher volatility and slower recovery to all-time highs.

XRP 10-Year Growth Compared to Bitcoin

Morgan referenced a response generated by xAI chatbot Grok, which estimated XRP’s 10-year gain at roughly 23,000% to 24,000%. Remarkably, market data supports that calculation.

At press time, XRP was trading around $1.42. On May 16, 2016, XRP traded at about $0.006018. That means the asset increased by approximately 23,500% over the period.

Meanwhile, Bitcoin traded near $79,000 at press time compared to $452.95 on May 16, 2016. That represents a gain of around 17,300%.

Based on those numbers, XRP delivered larger percentage gains than Bitcoin over the exact 10-year window highlighted in the discussion.

Image

Critics Say the Timeframe Is Selective

However, not everyone agreed with Morgan’s comparison. Several users on X argued that the data relies on a carefully selected starting point that benefits XRP.

X user @TheyLiveYouDie criticized the comparison, saying XRP reached around $3.80 nearly nine years ago and still trades far below that level today. The user argued that, despite strong growth from 2016 levels, many investors who bought near previous cycle highs remain at a loss.

Another user, @Encrypt_ed, also questioned the argument and suggested using 2019 as the starting point instead. The user claimed to have bought XRP around the 2018–2019 period at roughly $3.40 and said the investment remains underwater despite believing in the technology behind the asset.

The criticism highlights that while some investors focus on long-term percentage gains from early adoption, others pay closer attention to whether an asset consistently sets new highs across multiple market cycles.

Bitcoin’s Consistency Versus XRP’s Volatility

Morgan responded to critics by saying he did not choose the timeframe himself. According to him, he simply added XRP to the list originally shared by Bitcoin Magazine.

The debate shows how different timeframes can dramatically change the perception of crypto performance. Early XRP buyers from 2016 may see enormous gains today, while investors who entered during later market peaks may still be waiting for a recovery.

The discussion also highlighted a key difference between Bitcoin and XRP over the years. Indeed, XRP posted larger percentage gains from 2016 lows. Yet, Bitcoin maintained a more consistent long-term upward trend and repeatedly broke previous all-time highs.

XRP, on the other hand, has experienced greater volatility and has struggled to revisit its 2018 peak of $3.84, according to CoinMarketCap data.

Expert Reveals What Became of a $100K Shiba Inu Investment in 12 Months

0

A popular crypto analyst recently revealed how a $100,000 investment in Shiba Inu has performed over the past 12 months.

Ash Crypto shared the analysis while comparing the one-year performance of major traditional assets and cryptocurrencies. The comparison showed that traditional markets, including NVIDIA, the S&P 500, and the NASDAQ, generated strong positive returns during the period. 

In contrast, many cryptocurrencies recorded steep losses. Among the worst-performing assets listed was Shiba Inu, which reportedly declined by 64%.

Key Points 

  • Crypto analyst Ash Crypto revealed that a hypothetical $100,000 investment in Shiba Inu made one year ago would now be worth approximately $36,000.
  • The analysis further showed that traditional financial markets significantly outperformed most cryptocurrencies during the same period.
  • While NVIDIA reportedly delivered a 74% yearly gain, Bitcoin and Ethereum declined by 28% and 17%, respectively.
  • Shiba Inu, which trades near $0.0000060, has fallen almost 40% from its 2026 peak.

$100K Investment in SHIB Dips to $36K in One Year 

According to Ash, a hypothetical $100,000 investment in SHIB one year ago would now be worth roughly $36,000, reflecting the reported 64% drop.

Furthermore, the comparison exposed widespread weakness across the crypto market, as meme coins and altcoins such as Pepe, Dogecoin, Ondo, Uniswap, and Official Trump recorded double-digit losses. 

Even Bitcoin and Ethereum finished the period in negative territory, with a hypothetical $100,000 investment in the two assets now worth approximately $72,000 and $83,000, respectively, according to Ash Crypto.

In contrast, Ash revealed that NVIDIA reportedly delivered a 74% gain over the same timeframe, while the S&P 500 and NASDAQ returned 27% and 39%, respectively. As a result, Ash Crypto’s analysis underscored how traditional assets significantly outperformed most cryptocurrencies over the past year. 

A Turbulent Year for Shiba Inu 

Meanwhile, the broader crypto market has experienced intense volatility over the past year. In May 2025, Shiba Inu traded around $0.0000145 to $0.0000148, maintaining four leading zeros after the decimal point. 

However, Shiba Inu later experienced a sharp selloff, which added another zero to its price. SHIB now trades near $0.000006080, marking a decline of nearly 60% from its level a year ago and closely supporting Ash’s claim. In addition, the token has dropped almost 40% from its 2026 peak of $0.00001. 

Broader Market Downturn Marred SHIB Price Action 

Meanwhile, SHIB was not the only cryptocurrency to suffer from the broader market downturn. Several macroeconomic and geopolitical developments, including tariff disputes between the United States and other major economies, alongside escalating tensions in the Middle East, have continued to pressure the crypto market.

More recently, Shiba Inu attempted to reclaim the $0.000007 level before bearish momentum triggered another decline. The token subsequently fell from its weekly high of $0.0000067 to around $0.000006. As a result, SHIB is now down 6.52% over the past week and 3.2% in the last 24 hours. At the same time, trading volume has dropped 10.6% over the past day to approximately $109 million.

XRP Sees Renewed Interest as Binance Leverage Ratio Reaches 2-Month Peak

XRP is now witnessing renewed interest, as its estimated leverage ratio on Binance soars to a two-month peak.

Notably, this surge in leverage ratio occurred on the back of a recent price rebound effort from XRP, as it leveraged the broader market upward push to reclaim the $1.54 price area for the first time since March.

Key Points

  • The recent price recovery pushed XRP to $1.54 on May 14 before a pullback emerged.
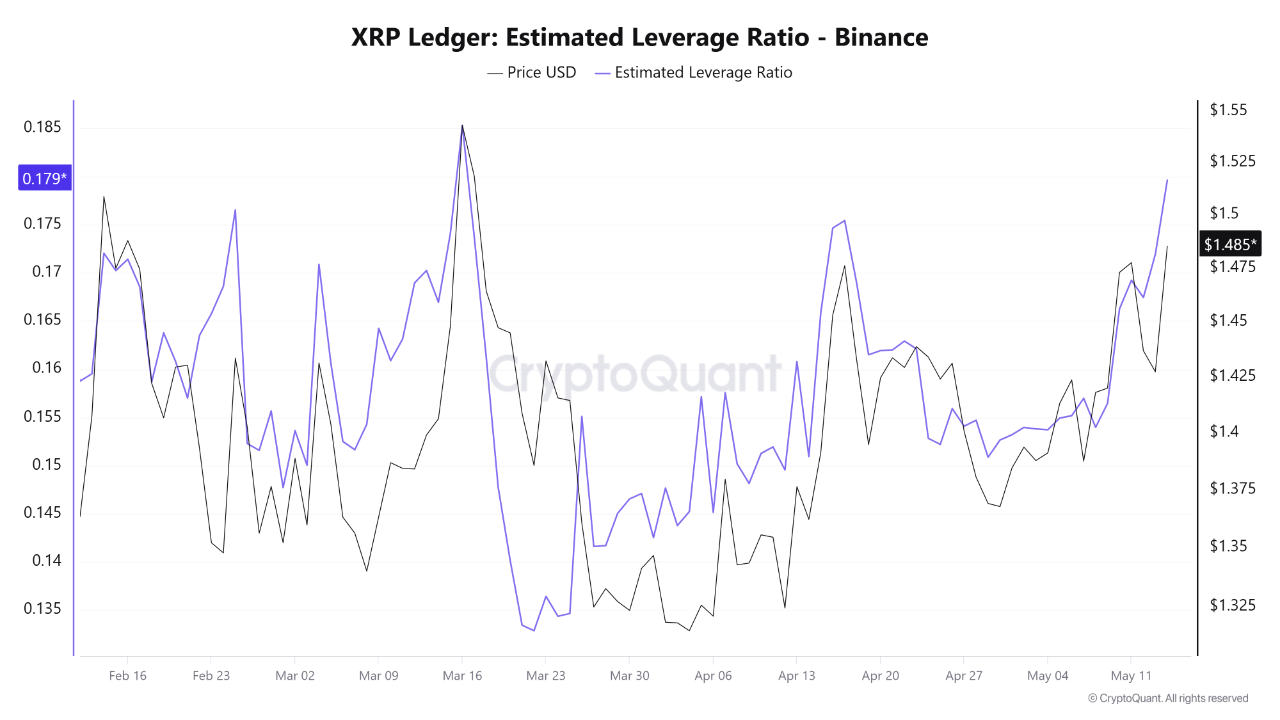
  • During the price rebound, the Binance leverage ratio rose to 0.179, its highest level in two months.
  • As prices pulled back, XRP futures volume dropped over 40% to $3.7 billion, and open interest fell 6.69% to $2.86 billion.
  • Long positions make up about 97% of the $7.62 million total liquidations, confirming bullish losses.

XRP Recovers as Market Sentiment Improves

Verified CryptoQuant analyst Arab Chain was the first to highlight the current market situation during the recent price rebound. Specifically, XRP saw a strong recovery in recent days as the wider crypto market turned positive again. 

The token rose from $1.38 on May 8 to a two-month high of $1.54 on May 14 amid renewed buying interest from traders. While XRP later pulled back from this peak, the rally still brought renewed attention to the asset and increased activity in its derivatives market.

XRP Binance Leverage Ratio Hits 2-Month High

During the recovery, Arab Chain called attention to a sharp rise in Binance’s Estimated Leverage Ratio (ELR). In his latest analysis, he explained that traders had started using more leverage as XRP’s price moved higher.

According to Arab Chain, Binance’s XRP Estimated Leverage Ratio climbed to around 0.179, reaching its highest level in nearly two months. The increase came while XRP traded close to $1.48. He noted that the ELR had moved steadily higher over the past few days after staying weak since mid-March. 

Earlier, the indicator remained at relatively low levels, but the latest jump pushed it to its strongest reading in two months. This rise showed that traders had become more active in leveraged XRP positions, especially in the futures market.

XRP Estimated Leverage Ratio on Binance CryptoQuant
XRP Estimated Leverage Ratio on Binance | CryptoQuant

Arab Chain also attributed the increase in leverage to XRP’s gradual price recovery in recent weeks. He suggested that part of the new money entering the market likely came from traders expecting more upside movement or stronger short-term volatility.

However, the analyst warned that higher leverage also increases market risk. When too many traders use leverage, sudden price swings can trigger large liquidation events if the market moves against open positions.

XRP Derivatives Activity Slows After Pullback

While leverage levels rose during the rally, recent data from CoinGlass indicates that XRP derivatives activity has weakened after the price pulled back from $1.54.

The data shows that XRP futures volume dropped by more than 40% over the past 24 hours to $3.7 billion at press time. Open Interest also fell by 6.69% to $2.86 billion as liquidations increased and some traders closed their positions after the recent decline.

XRP Derivatives Activity Coinglass
XRP Derivatives Activity | Coinglass

Meanwhile, XRP’s long-to-short ratio in the last 24 hours stood at 0.8911. This figure confirms that traders now hold more short positions, indicating a growing bearish outlook across the market.

Long Liquidations Trigger Bearish Sentiment

Liquidation data further explains why the market is seeing a change in sentiment. Specifically, over the past 24 hours, XRP recorded $7.62 million in liquidations, with long positions making up $7.44 million, or about 97% of the total.

The same pattern appeared across shorter timeframes. In the last 12 hours, long positions accounted for $2.42 million out of $2.43 million in total liquidations. Over the past four hours, long liquidations reached $2.28 million from a total of $2.29 million.

XRP Liquidation Data Coinglass
XRP Liquidation Data | Coinglass

The heavy wave of long liquidations followed XRP’s drop from $1.54 to its current price of $1.41. As bullish trades got wiped out, many traders pivoted toward bearish positions and started expecting further downside. This change in sentiment also helped drive Open Interest lower.

Still, when too many traders lean bearish, the market sometimes moves in the opposite direction. For now, XRP needs to hold above the important $1.40 support level to avoid a deeper decline in the near term.

XRP Network Activity Hits 2-Month Highs Amid Price Spike to $1.54

Data from Santiment confirms that the recent XRP price recovery resulted in a major rise in network activity on the XRPL.

XRP recently joined the broader crypto market recovery, climbing to a weekly high of $1.5487 before meeting resistance and falling back below $1.5. While the rally has slowed, new data shows that the price increase came alongside a jump in activity on the XRP Ledger (XRPL).

Key Points

  • XRP’s price rose above $1.54 before pulling back below the $1.5 level amid broader market recovery.
  • Santiment reported 48,453 active XRPL addresses, the highest daily figure since March 30.
  • XRPL network growth reached 3,317 new wallets, its strongest reading since March 19.
  • Activated accounts have now climbed to 7,856,080, moving closer to the 8 million milestone.

XRP Price Rally Leads to Increased Network Activity

Market analytics platform Santiment reported that the recent XRP rally pushed network activity to its highest level in nearly two months. According to the firm, XRP’s move above $1.54 for the first time in two months helped drive a strong increase in on-chain activity across the XRPL.

Santiment revealed that active addresses on the network reached 48,453 within a 24-hour period, the highest level since March 30. Also, network growth rose to 3,317, marking its strongest reading since March 19.

The analytics firm explained that much of the increase likely came from investor excitement surrounding XRP’s latest price move. 

Despite this, Santiment noted that higher transaction activity remains an important sign for both medium- and long-term price growth. According to the platform, wider adoption across a blockchain network usually justifies higher valuations.

Network Growth Trends

Data from Santiment’s chart shows that new wallet creation on the XRPL stayed relatively low for most of May. Before the latest surge, the metric only saw a gradual increase from late April into the beginning of the month.

XRP Ledger Network Activity Santiment
XRP Ledger Network Activity | Santiment

This trend later weakened, with newly created wallets dropping to the low 2,200 range on May 10. However, the metric recovered the following day and has continued moving higher. This recovery eventually pushed network growth to the latest figure of 3,317 new wallets.

Following the recent rise in wallet creation, activated accounts on the XRP Ledger have now climbed to 7,856,080. With the current pace, the network is now moving closer to the major milestone of 8 million wallets.

Meanwhile, unlike wallet growth, active address activity did not follow a steady trend during this period. Santiment’s chart shows that the metric continued to move between daily highs and lows without a clear direction.

XRPL Onchain Data

Separate blockchain data from XRPScan also confirmed the recent increase in XRPL activity. According to XRPScan, the “number of active users (source tag + destination tag)” metric moved above 184,000 on May 15.

This figure marked the second-highest reading recorded since the beginning of April. For context, the network uses this metric to estimate daily active users by tracking unique addresses involved in transactions that include Source Tags or Destination Tags.

The data also shows a rise in failed transaction attempts across the network. Specifically, XRPScan reported that transactions returning the “tecNO_PERMISSION” error climbed to 1,332 on May 19, the highest level since March 31. This error appears when a sender lacks permission to complete an operation.

Also, transactions producing the “tecINSUFFICIENT_FUNDS” error rose to 656 on May 19, marking the highest reading since April 19. This error occurs when the sender does not hold enough of the required asset to complete the transaction.

Shiba Inu: Crypto Mentor Reveals Student Made $600K From $30 SHIB Bet

Crypto commentator Xeusthegreat recently shared a personal story that highlights the life-changing profits some early investors made during Shiba Inu’s historic rally. 

According to Xeusthegreat, one of his students transformed a modest $30 investment in Shiba Inu into more than $600,000 during the meme coin’s explosive bull run. The story reflects the extraordinary wealth-generation opportunities that emerged at the peak of the meme coin frenzy, particularly around Shiba Inu.

Key Points

  • Crypto commentator Xeusthegreat revealed that one of his students reportedly turned $30 into more than $600,000 during Shiba Inu’s historic rally.
  • The student allegedly sent Xeusthegreat the largest cash gift he had ever received as a token of appreciation for his guidance.
  • Shiba Inu became a major symbol of retail wealth creation in 2021, transforming the financial status of many ordinary investors.
  • However, weakening community enthusiasm and declining token burns have led analysts to doubt whether SHIB can replicate its 2021 performance.

Student Turns $30 Into $600K

Pseudonymous crypto commentator Xeusthegreat recently recalled how one of his students reportedly turned a $30 investment in Shiba Inu into more than $600,000 during the token’s historic rally.

According to Xeusthegreat, the student initially sold part of the holdings and later sent him money as a gesture of appreciation. He further revealed that he encouraged the investor to sell the remaining SHIB holdings close to the token’s all-time high, helping preserve most of the profits before the market correction began.

Following the successful exit, the student allegedly sent him another cash gift, which Xeusthegreat described as the largest he has ever received.

The story serves as another reminder of the extraordinary returns generated during the peak of the meme coin boom, when small investments in speculative crypto assets occasionally produced life-changing wealth for early participants.

Shiba Inu Remains a Symbol of Retail Wealth Creation

For context, Shiba Inu emerged as one of the biggest success stories of the 2020/2021 crypto cycle. After launching in August 2020 and trading around $0.000000000056, the token embarked on a historic rally. Within 14 months, SHIB surged to an all-time high of $0.00008845, dramatically changing the financial fortunes of many early investors. 

Several notable success stories emerged during that period. For instance, two brothers from Chicago reportedly turned an early SHIB investment of about $8,000 into $9 million. Similarly, a truck driver allegedly transformed a $650 investment into $1.7 million through SHIB holdings.

One of the most famous trades in Shiba Inu’s history involved an investor who turned an $8,000 investment into $5.7 billion when SHIB reached its peak in October 2021. 

Can Shiba Inu Replicate Its Explosive Rally? 

Following these remarkable success stories, many investors continue to wonder whether SHIB can still deliver massive returns to new holders. However, several factors that fueled the token’s historic rally have weakened significantly.

Notably, Shiba Inu’s previous surge relied heavily on strong community enthusiasm, massive exchange listings, and the 410 trillion token burn conducted by Vitalik Buterin. 

Since then, the market environment has changed considerably. SHIB has plunged more than 93% from its all-time high and is now trading at $0.000006082. The token’s community engagement has also weakened.

In addition, daily token burns now remove only a few million SHIB from circulation, which many analysts consider insignificant relative to the token’s massive supply. Furthermore, critics continue to point to incomplete ecosystem projects and a reduced focus on SHIB development compared to its early years.

As a result, several analysts believe it is unlikely that SHIB will generate another wave of life-changing gains unless the project resolves these challenges and regains stronger market momentum. 

Bitcoin Network Growth Rebounding Fast, Hinting at End of Local Bottom: Glassnode

Blockchain analytics firm Glassnode says Bitcoin network activity is showing signs of a strong recovery.

This trend has historically aligned with the end of local market bottoms and the return of bullish momentum. The analysis comes at a time when Bitcoin continues to trade near $80,000 without a decisive breakout from its current range.

Key Points

  • Bitcoin network growth is rising fast, a signal that previously marked the end of local BTC market bottoms.
  • Glassnode says Bitcoin’s Network Growth metric is nearing a key bullish inflection zone above 60.
  • BTC options data shows traders remain cautiously bullish despite ETF outflows and CPI concerns.
  • Glassnode identifies $82K as a key breakout level that could trigger stronger Bitcoin momentum.

Bitcoin Network Growth Metric

In a recent post on X, Glassnode noted that Bitcoin’s “Network Growth” metric is rising quickly and approaching a key threshold within the firm’s proprietary Vector framework.

According to the analytics platform, previous surges above the 60 level have marked the beginning of stronger market conditions for BTC.

Image

Notably, rising network growth reflects an increase in new users, wallet activity, and overall participation on the Bitcoin network. Historically, these spikes have appeared during periods when the market was recovering from prolonged weakness.

Glassnode’s latest chart suggests Bitcoin may now be nearing a similar inflection zone once again.

While the firm did not provide a specific price target, the rebound in network activity may strengthen bullish sentiment across the market, especially if participation continues to increase in the coming weeks.

BTC Options Market Shows Cautious Optimism

Glassnode also shared new insights from the Bitcoin options market. It noted that BTC has continued to hold above $80,000 despite recent ETF outflows and a slightly hotter-than-expected U.S. CPI report.

According to the analytics firm, current derivatives positioning suggests traders remain cautiously bullish, even as volatility expectations stay relatively muted.

Volatility Stays Low

According to Glassnode, market volatility remains relatively calm. One-week implied volatility is around 35%, while one-month and six-month volatility levels are about 37% and 42%, respectively.

The firm said this shows traders are not expecting panic or extreme price swings in the short term.

Image

Traders Still Protect Against Downside Risk

Meanwhile, even with calmer market conditions, traders are still buying some protection against a possible BTC decline. Glassnode noted that demand for protective put options remains higher than demand for bullish call options.

However, hedging activity has cooled compared to earlier weeks. This suggests traders remain cautious about downside risks, but are less worried than before.

Glassnode also pointed out that Bitcoin’s recent price movement has become more stable. One-month realized volatility has fallen to around 28%, while implied volatility remains near 37%.

This means traders still expect larger price moves ahead, even though current market activity is calmer.

$82K Could Be Important for Bitcoin

Glassnode identified the $82,000 level as a key area to watch. The firm explained that if Bitcoin’s price moves above $82K, it could trigger stronger upward momentum due to dealer hedging activity.

Meanwhile, the $85,000 level may act as a stabilizing zone if BTC continues rising.

Overall, Glassnode said market conditions have become calmer, hedging demand has eased, and trader positioning is more balanced.

Still, traders remain cautious beneath the surface, with many closely watching the $82,000 level as Bitcoin’s next major test.