Home Blog Page 419

Here’s How Many XRP Need to Be Burned to Reach Ethereum’s Price

0

A new analysis explores how much XRP would need to be burned for its price to match Ethereum. 

With XRP trading at $2 and Ethereum at $2,823, the comparison highlights the enormous impact circulating supply has on valuation.

Specifically, XRP has a circulating supply of 60.25 billion coins, giving it a market cap of roughly $120.5 billion at $2 per token. Ethereum, at $2,823, has a much smaller circulating supply of 120.69 million ETH, resulting in a market cap of about $340.5 billion.

For XRP to reach the same price as Ethereum, it would need to support a similar market cap. That can only happen by drastically shrinking its circulating supply to levels comparable with Ethereum’s. 

The comparison shows that XRP’s enormous token count of over 60 billion is a primary reason its price cannot approach Ethereum’s range under current conditions.

The Supply Adjustment XRP Would Need

If XRP’s circulating supply were reduced from 60.25 billion to the same 120.69 million units Ethereum has in circulation, the price of each XRP would mathematically rise to around $2,823, assuming its market cap matched Ethereum’s. Achieving this would require eliminating almost the entire supply of XRP.

Specifically, reducing XRP’s supply from 60.25 billion to 120.69 million would mean burning approximately 60.13 billion tokens. Only then would scarcity, in theory, increase enough to push its valuation into Ethereum territory.

What a 60 Billion Burn Would Mean

Burning such a large quantity of XRP would fundamentally transform the asset. Scarcity would surge, liquidity would tighten, and the remaining tokens could become significantly more valuable. In theory, this could lift the price toward $2,823, aligning it with Ethereum’s current valuation.

However, this scenario remains extremely unlikely. Implementing a coordinated burn of more than 60 billion tokens would require community support, participation from major holders, and Ripple itself. In particular, this scenario would require people to permanently give up their XRP holdings.

This raises the question of who would actually benefit from any resulting price surge if many holders had already sacrificed their tokens to enable it.

Meanwhile, supply reduction alone doesn’t determine price. Without sustained demand, even a drastic supply cut wouldn’t guarantee Ethereum-level pricing for XRP.

Realistic Long-Term Supply Reductions

Recent discussions around XRP’s deflationary nature highlight a more gradual path. XRP burns tokens through transaction fees, averaging roughly 5,000 tokens per day.

Some projections suggest that if this rises to 15,000 or even 20,000 daily, total supply could shrink more noticeably by 2035.

However, at the current burn rate, only around 1.8 million XRP are burned per year — insignificant compared to the 100 billion maximum supply.

Meanwhile, analysts studying long-term burn scenarios estimate that even with rising network activity, XRP might shed only a few dozen million tokens over the next decade — far from the 60 billion required to create Ethereum-like scarcity.

A separate model explores what XRP’s price would look like if the circulating supply fell to 40 billion tokens. Assuming the market cap remains around $179 billion, XRP could trade near $4.48.

If demand grows while supply declines, the price could rise toward $6 or even higher. In more aggressive scenarios that combine burns with increased utility, some projections place long-term values in the $12 to $16 range.

Theory Only, Not a Practical Path

Burning more than 60 billion XRP to match Ethereum’s supply is mathematically sound but economically unrealistic. Ripple and other large holders are unlikely to destroy assets worth over $180 billion at today’s prices.

Stellar previously executed a massive supply burn and saw little lasting impact on its token price, casting doubt on the effectiveness of engineered scarcity on price.

A more realistic future for XRP lies in gradual, organic developments. Token burns through regular network activity, and the ongoing adoption of Ripple’s payment solutions remains the true driver of long-term value.
Pundit Explains Why XRP ETFs Haven’t Pumped XRP Price Yet

0

The launch of spot XRP ETFs triggered excitement among investors, but the XRP price continues to slide despite strong institutional inflows. 

Specifically, the Canary Capital XRP ETF (XRPC) made a strong entrance with $245 million in debut inflows. XRPC kept this momentum going over the next several days and drew steady demand for four straight sessions, pushing total inflows past $292 million by day four. 

XRP Price Struggles Despite ETF Inflows

On day five, which was yesterday, XRPC added another $12.8 million, raising its cumulative inflows since launch to $305.4 million.

Interestingly, the market saw another boost that same day when the Bitwise XRP ETF, listed as XRP, officially launched. Bitwise attracted $105.36 million on its first day. With both products now trading, total inflows across all spot XRP ETFs reached $410.76 million. 

XRP ETF Flows Sosovalue
XRP ETF Flows | Sosovalue

However, instead of rising or holding strong, XRP continues to fall in line with the rest of the crypto market. XRP price has dropped 13.16% over the past week and slipped below the $2 psychological support level, trading at $1.98 as of press time. 

Amid the disappointing price action, XRP holders have grown frustrated, especially after waiting all year for these ETFs, questioning why the heavy inflows have not lifted the price.

How ETFs Work

In a recent commentary, community member VanQish addressed these concerns and explained how XRP ETFs actually work. According to him, many investors still misunderstand how these funds buy XRP. 

He stressed that an ETF does not operate like a tank that fills or empties at fixed intervals. Instead, the ETF adjusts its XRP holdings in response to demand for its shares. This is largely correct, as ETFs rely on a flexible system that expands or shrinks through creation and redemption of shares, not through a fixed refilling cycle.

Further, VanQish explained that the ETF increases its XRP holdings only when authorized participants create new shares. These participants, usually large financial institutions or market makers, deliver XRP or cash to the ETF sponsor to mint a fresh block of shares. 

The process increases the amount of XRP inside the fund. Notably, the participants often deliver XRP directly, since doing so cuts costs and speeds up the process, although cash delivery remains an option.

On the other hand, the ETF reduces its XRP holdings only when authorized participants redeem shares. They return ETF shares to the sponsor and receive XRP or cash in exchange. 

This process shrinks the basket of XRP inside the fund. Notably, retail traders cannot redeem shares directly, which helps the system stay efficient and orderly, keeping the ETF aligned with the value of the underlying asset.

Trading on Exchanges Does Nothing for XRP Price

VanQish also pointed out that heavy trading on an exchange does not automatically move real XRP. Specifically, when investors buy or sell ETF shares on the secondary market, they simply trade ownership of the shares. 

Actual XRP moves only when market conditions force authorized participants to create or redeem shares. Importantly, this step is what connects ETF activity to real XRP demand.

He also highlighted what happens when an ETF trades at a premium. Notably, if the XRP ETF price rises above the value of the XRP it represents, authorized participants step in to arbitrage the difference. 

They arbitrage by buying XRP from the open market or sending cash to the sponsor so the ETF can acquire XRP and rebalance its holdings. Direct XRP delivery usually works faster and avoids extra costs.

When Will XRP Price Start Reacting to ETF Demand?

Considering all these mechanisms, VanQuish noted that the market will see real price movement only when authorized participants can no longer find cheap XRP to meet creation demand. 

He said an ETF launch alone does not trigger a rally. Instead, growing creation obligations will force participants to compete for available XRP. 

Once the easy supply dries up, a true supply squeeze begins, and that pressure can push prices sharply higher. Notably, Bitcoin price also suffered declines immediately after ETFs launched in January 2024 but recovered weeks later to new all-time highs.

Analyst Predicts How Many XRP ETFs Could Accumulate in 1 Year

0

Analyst Chad Steingraber has released a new model projecting how much XRP spot ETFs could accumulate within one year.

His updated figures suggest that, at current prices, the first wave of ETF issuers could collectively drain a massive portion of the circulating supply long before the market witnesses the price impact.

Seven ETF Issuers Could Absorb Over 22 Billion XRP in One Year

Steingraber’s model begins with the seven ETFs set to dominate the first phase of inflows. Based on current market conditions and projected demand, he estimates the following one-year XRP acquisition totals:

  • Canary Capital: 1,865,845,440 XRP
  • Bitwise: 2,843,601,888 XRP
  • 21Shares: 7,109,004,720 XRP
  • CoinShares: 63,507,109 XRP
  • WisdomTree: 3,981,042,654 XRP
  • Grayscale: 853,080,564 XRP
  • Franklin Templeton: 5,687,203,680 XRP

Together, these seven funds could accumulate 22.4 billion XRP within one year, consuming more than one-third of the circulating supply.

Phase Two: Total Could Rise to Nearly 40 Billion XRP

Steingraber then models a second wave of XRP ETF products, with 3.48 billion tokens in annual accumulation across five additional funds. When combined with the first-phase issuers, the total becomes 39,803,286,055 XRP.

With the circulating supply just over 60 billion XRP, these projections imply that institutional products could absorb more than two-thirds of all publicly available XRP within one year.

Why the Supply Could Vanish This Fast

The model assumes that current XRP price levels remain stable, ETF inflows continue to grow in line with early market enthusiasm, and issuers source XRP through OTC trades that do not immediately move spot markets.

Steingraber argues that, under these conditions, ETFs will aggressively accumulate XRP until the price becomes too high for the same levels of capital inflow to maintain their pace. In his view, the only scenario that prevents a complete drain of public supply is a dramatic increase in XRP’s price, which would naturally reduce the rate of acquisition.

To put it in perspective: if XRP were $100 per coin, ETFs could buy fewer tokens with $1 billion. On the other hand, if the price dips to $1, they could buy far more tokens with the same $1 billion. According to Steingraber, both scenarios are ultra-bullish for XRP holders.

No Price Impact on XRP Yet

Notably, these analyses continue to surface as XRP faces muted price action since the launch of ETFs. Proponents attribute the lack of impact on XRP’s price to the bulk of fund acquisitions occurring OTC and settling on delayed cycles.

Nonetheless, they remain confident that, in the long run, XRP’s price will react to the behind-the-scenes accumulation as inflows into ETFs continue. Ultimately, Steingraber’s projections emphasize that a supply shock is imminent, and its realization could have a dramatic effect on XRP’s price.

Data Shows Bitcoin Has Entered Its Most Bearish Phase in 2 Years: Reversal Next?

0

According to a CryptoQuant analysis, Bitcoin has entered its most bearish phase since the current bull market began two years ago.

For context, Bitcoin (BTC) continues to slide, pulling the broader crypto market down with it. After reaching a high above $126,000 on Oct. 6, the crypto firstborn has now dropped more than 28%, erasing roughly $710 billion in market value, as it trades near $90,197.

Bitcoin In Its Most Bearish Phase Since January 2023

Amid the downtrend, CryptoQuant, in its latest weekly update, reported that Bitcoin now sits in its most bearish conditions since the bull cycle began in January 2023. 

The firm noted that this pullback looks different from earlier corrections in the cycle. Notably, it pointed out that its Bull Score Index fell to a deeply bearish reading of 20 out of 100 last week due to weaker spot demand, negative price momentum, and a slowdown in stablecoin liquidity.

In addition to this, CryptoQuant confirmed a major technical change. Specifically, Bitcoin recently moved below its 365-day moving average, a level that marked the confirmation of the 2022 bear market. 

The firm emphasized that Bitcoin had stayed above this trendline during every other correction in the current bull run, which makes the recent breakdown especially important.

As a result, CryptoQuant believes the market has entered a clearly bearish phase. This comes a few days after the CryptoQuant CEO, Ki Young Ju, suggested that Bitcoin had still not entered a bear market.

Demand From Treasuries and ETFs Weakening

The company also spotlighted the demand side, explaining that Treasury companies no longer support prices the way they did earlier in the year. Their market values have fallen by 70% to more than 90% in recent months, which prevents them from selling new shares to raise capital for additional Bitcoin purchases. 

Moreover, despite purchasing 8,178 BTC earlier this week, CryptoQuant highlighted that Michael Saylor’s Strategy has also reduced its own buying because its stock market cap has dropped toward the value of its Bitcoin holdings.

The firm also reviewed ETF activity, stressing that ETF inflows can slow or even reverse. Notably, some institutions buy spot Bitcoin through ETFs while shorting futures to capture the spread. When that spread tightens, they unwind the trade and sell spot Bitcoin. For perspective, Bitcoin ETFs have seen outflows worth $2.89 billion this month.

Will the Current Bitcoin Cycle Stretch to 2026?

The report then called attention to the idea of Bitcoin’s four-year cycle. For context, previous cycles spanned 2014 to 2017 and 2018 to 2021, so many expected the current one to end in 2025. 

CryptoQuant noted that this pattern originally came from the halving’s supply shock, but that effect has weakened as more tradable Bitcoin enters the market. 

Some analysts now expect the cycle to stretch into 2026, arguing that institutional investors, rather than retail traders, now drive most of the demand. Still, CryptoQuant warns that institutional demand can disappear just as quickly, as shown by the sudden pullback among Treasury companies.

Bullish Catalysts Already Priced in

CryptoQuant argued that Bitcoin’s cycle depends on demand surges rather than halvings or calendar patterns. It believes the current demand wave has largely played out. 

In 2024, Donald Trump’s election win pushed Bitcoin above $100,000 for the first time. In 2025, the rise of several Bitcoin Treasury companies lifted the price above $120,000 during the summer. 

CryptoQuant noted that these catalysts have already run their course, and potential new triggers either look unlikely or appear mostly priced in.

However, the report admitted that this situation does not guarantee a sharp crash. Specifically, Bitcoin has fallen 28% and now trades near strong support between $90,000 and $92,000. 

The firm pointed out that even during bear markets, Bitcoin often rallies 40% to 50% within a few months. Still, because the price now sits below the 365-day moving average, CryptoQuant expects the level near $102,600 to act as heavy resistance.

Is a Bitcoin Reversal Possible Now?

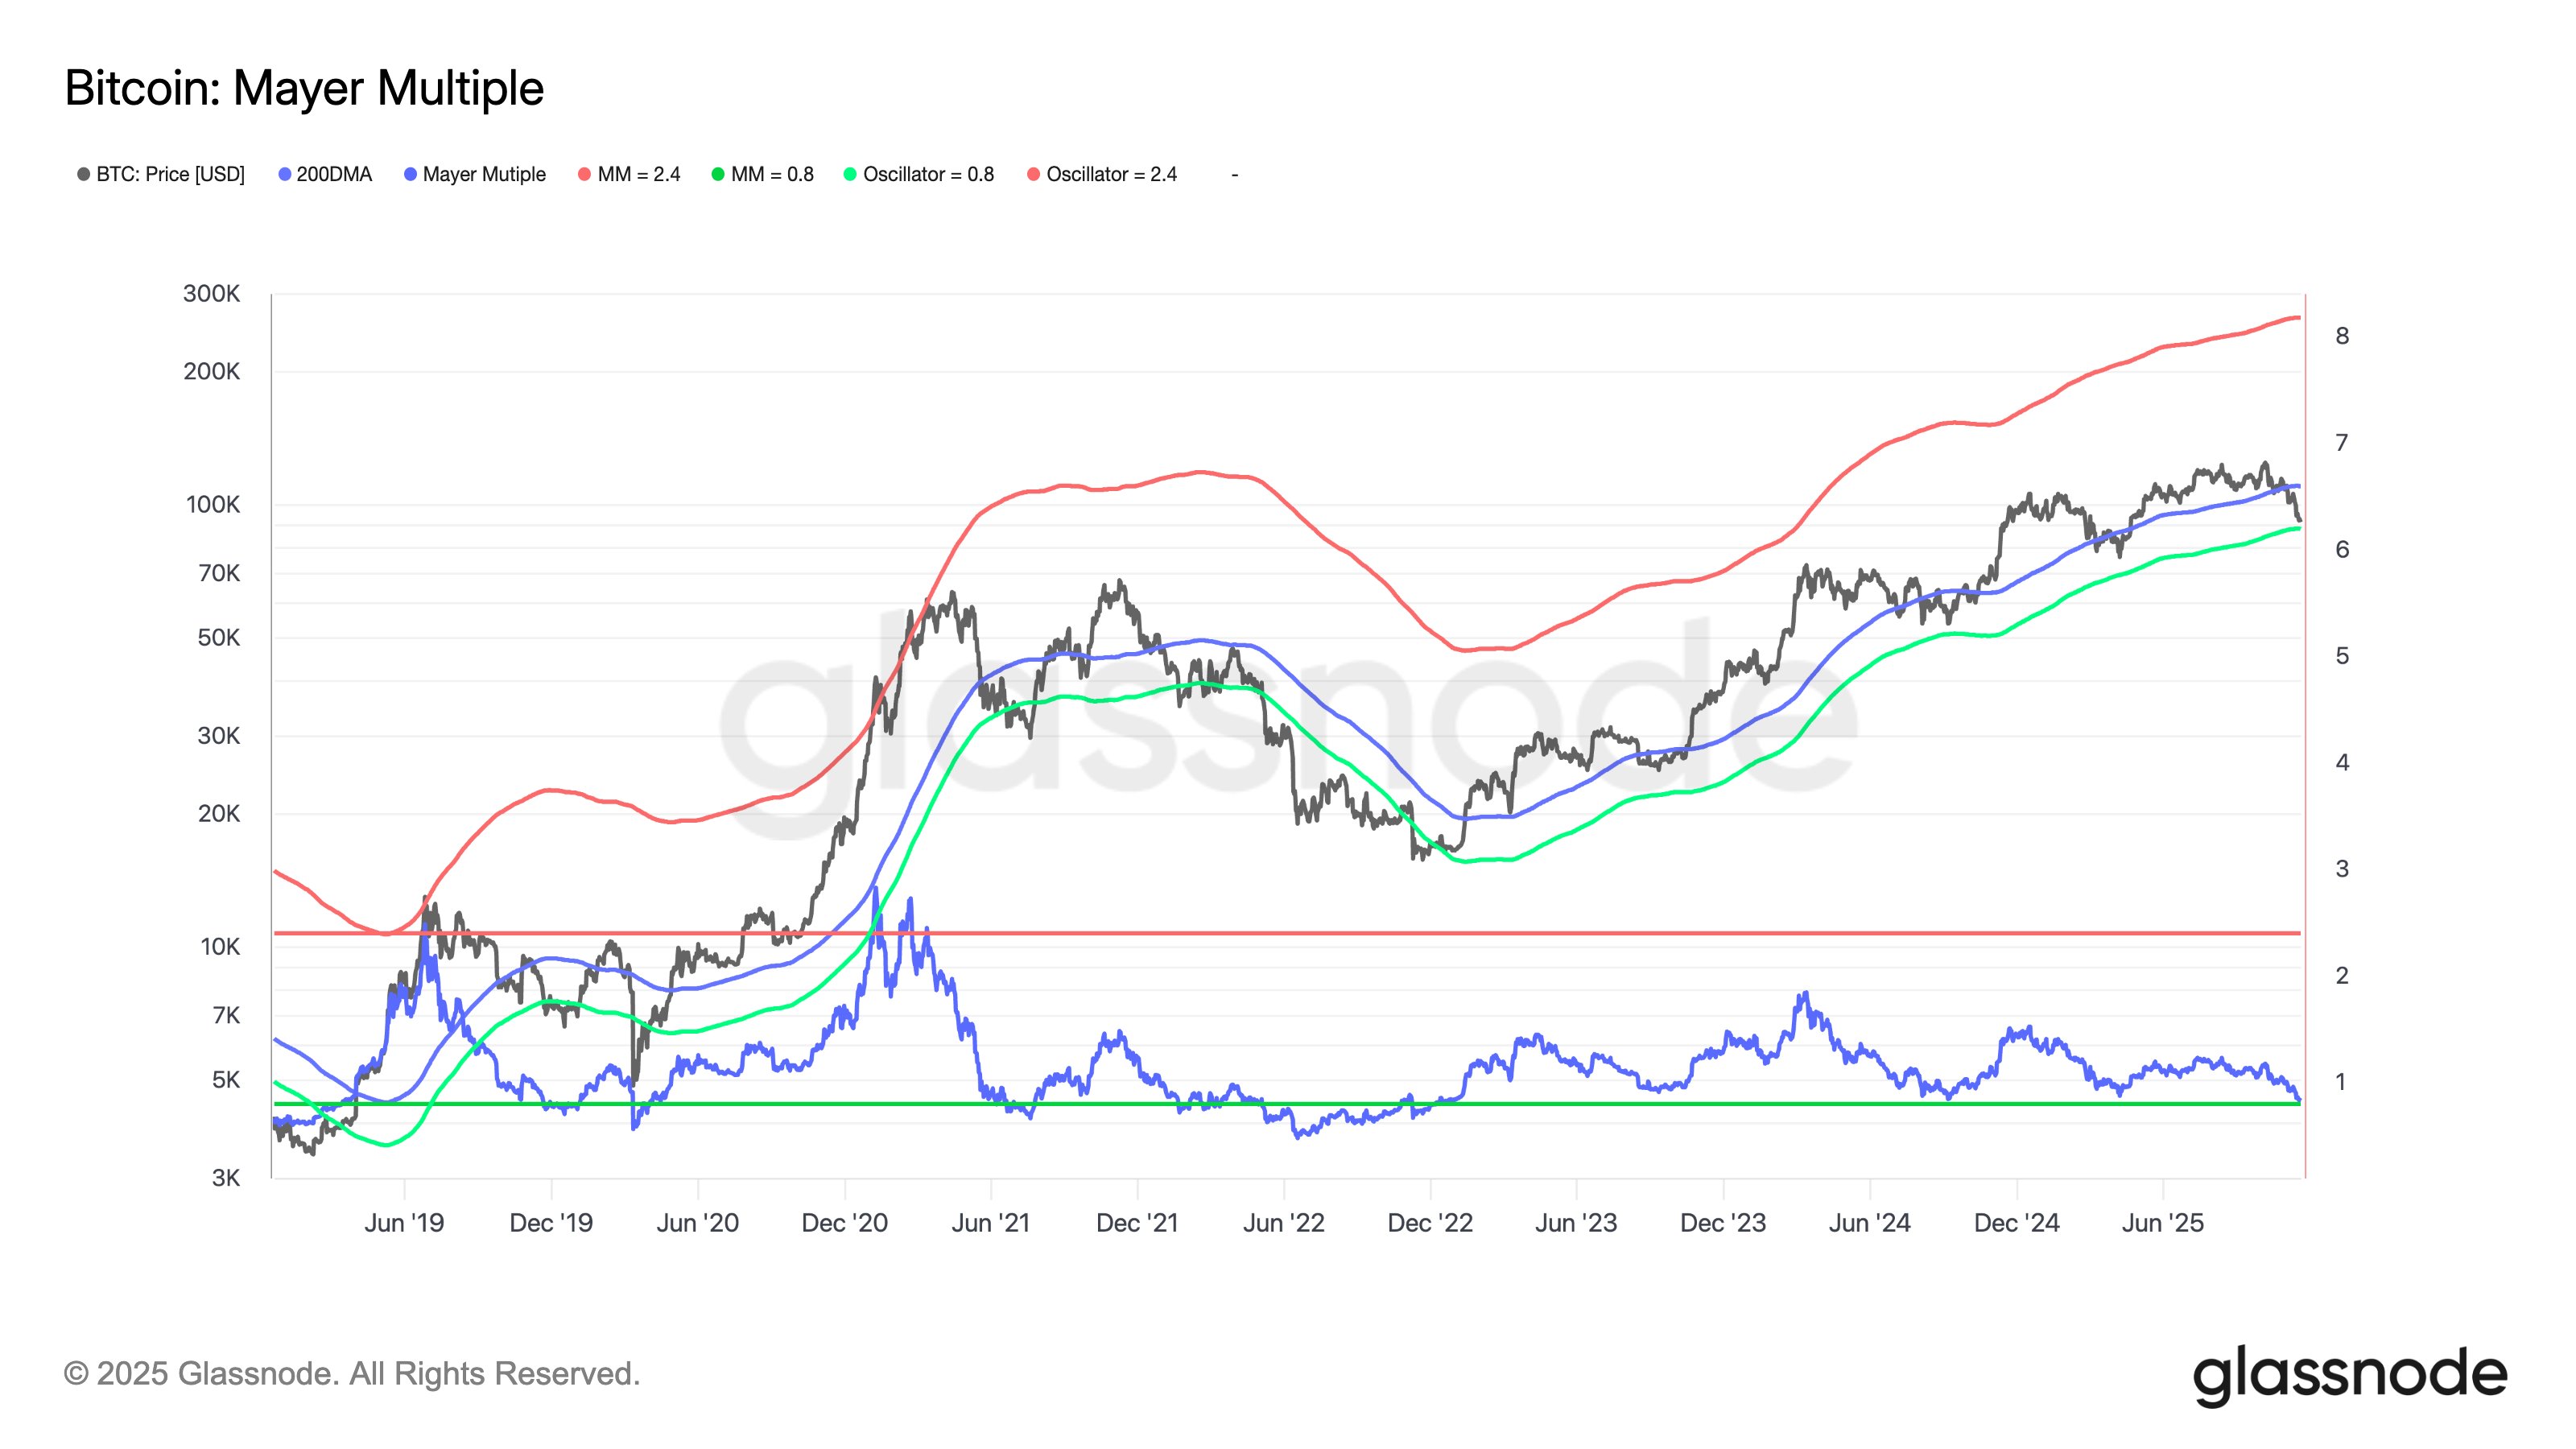
Meanwhile, in a separate disclosure, Glassnode noted that Bitcoin’s Mayer Multiple has dropped toward the lower end of its long-term range. The firm said this shift indicates slowing momentum and the early stages of a value-driven phase where buyers tend to re-enter.

Bitcoin Mayer Multiple Glassnode
Bitcoin Mayer Multiple | Glassnode

Also, analyst Cas Abbé expects a short-term rebound because daily and weekly RSI readings now show oversold conditions, and most panic sellers have likely exited. Abbé believes this setup could allow Bitcoin to push back above $100,000 soon.

Billionaire Ray Dalio Shares Why Bitcoin Cannot Be a Reserve Currency for Major Countries

0

Billionaire investor Ray Dalio says Bitcoin still cannot serve as a reserve currency for major countries, despite growing global interest in digital assets.

Speaking in a CNBC interview, Dalio revealed that he holds a small amount of Bitcoin, around 1% of his portfolio. However, he argued that Bitcoin’s design prevents it from becoming the foundation of national reserves.

Bitcoin is Trackable

Specifically, Dalio stated that Bitcoin can be tracked and may one day be vulnerable to quantum computing, which could allow governments or hackers to take control of it. According to him, these weaknesses make BTC unsuitable for the level of independence and resilience required of reserve assets.

Meanwhile, he added that physical gold remains the strongest non-fiat alternative because it does not depend on any digital network or issuer. In his view, that makes gold more reliable than Bitcoin in a world facing rising debt risks and political instability.

Interestingly, other world leaders, like ECB President Christine Lagarde, have used the argument of volatility to question Bitcoin’s suitability as a national reserve. However, despite these concerns, countries like the United States are moving forward with efforts to establish BTC as a national reserve.

Why Dalio Is More Concerned About Government Debt Than Crypto

While Bitcoin’s role has grabbed attention, Dalio repeatedly stressed that the real crisis lies in global government debt. He warned that debt issuance is rising rapidly across major economies, creating a dangerous imbalance between supply and demand.

Dalio explained that “debt is money and money is debt,” so when governments create too much, its value drops. Over the next three years, he expects this problem to worsen as countries borrow more.

He noted that the issue extends beyond the United States. Countries like the UK and France are reaching limits where markets no longer want additional government debt. At the same time, raising taxes pushes people away, cutting spending is politically impossible, and deficits continue to grow.

Private Markets Add Another Layer of Risk

Dalio also highlighted growing risks in private markets, such as private equity and venture capital. Firms are finding it harder to sell deals, earn returns, or raise cash, and many private credit products are tied to these struggling markets. He called this a “risky dynamic,” especially when combined with leveraged products like ETFs that amplify volatility.

Dalio added that rising wealth gaps and weak economies are fueling political instability, with some countries cycling through multiple leaders in just a few years.

Shiba Inu Bounces Back After Breaching Key Bollinger Band Support: What’s Next?

Shiba Inu breached a key Bollinger Band support level but recently rebounced, showing potential for short-term recovery as burn activity surges.

As of the latest data, Shiba Inu is trading at $0.00000863, reflecting a 0.8% decline over the past day. The coin has also experienced a notable downturn in the past week, plummeting by over 11.5% during this timeframe. Despite this recent dip, SHIB holds a market cap of approximately $5.08 billion, also down 0.9%.

Looking at the price chart, SHIB’s value has fluctuated within a 24-hour range of $0.00000824 to $0.00000872, proving volatility is still present in the market. While the broader market is expecting a recovery in the upcoming sessions, will SHIB continue falling or attempt a reversal?

Shiba Inu Price Analysis

Looking at technical charts on TradingView, the Bollinger Bands indicator for the Shiba Inu on the daily chart show key levels of support and resistance. Currently, the price is above the lower Bollinger Band (0.00000823), which often signals an oversold condition or a period of low volatility.

Notably, SHIB breached the lower band support yesterday but the bear pressure was not enough to sustain the move. 

Shiba Inu 1D Chart
Shiba Inu 1D Chart

Historically, when the price touches or comes close to the lower band, it tends to revert toward the middle band (the 20-period simple moving average), suggesting a potential short-term upward move.

The middle band, sitting at 0.00000834, serves as a key level to watch, with price potentially moving toward this area before encountering further resistance at the upper Bollinger Band, currently at 0.000010. To invalidate this setup, the bears must pull SHIB through the lower Bollinger Band with volume.

Meanwhile, the MACD indicator on the chart shows a relatively neutral stance, with the short-term moving average (blue line) still slightly below the long-term moving average (orange line), indicating minimal bearish momentum. 

However, the MACD histogram is shrinking, suggesting that bearish momentum is weakening. As the price moves toward the middle Bollinger Band, the MACD could align with this shift, confirming a reversal or consolidation.

SHIB Burn Activity Surges 23,864%

Elsewhere, burn data for SHIB indicates a significant increase in burn activity, with a burn rate of 23,864.38%. Over the last 24 hours, a total of 16,661,951 SHIB tokens have been burned.

Screenshot 2025 11 20T152939873

This surge is likely a result of increased efforts by the Shiba Inu community and ecosystem to reduce the overall supply, potentially boosting scarcity and supporting price action in the long term. 

Notably, a large portion of the recent burns comes from regular, smaller transactions, such as those transferring around 69,420 SHIB, but there have also been larger burns like 14,417,531 SHIB. The rate of burn activity can help manage inflation and may have a positive impact on SHIB’s price over time by decreasing the circulating supply.

Max Keiser Says Bitcoin Path Remains Clear Despite 500X Bigger Derivatives Market

0

Bitcoin commentator Max Keiser says the asset’s long-term path remains clear even amid short-term volatility from global derivatives markets.

He shared this perspective in a post on X today. He compared Bitcoin’s market environment to a small ship navigating a vast and turbulent ocean of financial derivatives.

Keiser argued that the derivatives market surrounding Bitcoin is so enormous that it dwarfs the asset itself, estimating it to be roughly 500 times larger than BTC’s current valuation. For context, Bitcoin currently holds a market cap of $1.83 trillion. Meanwhile, the global derivatives market exceeds $1 quadrillion in notional value.

Bitcoin Path Is Clear Despite Unpredictable Volatility

Illustrating this scale mismatch, Keiser shared a GIF depicting Bitcoin as a small boat navigating the overwhelming and unpredictable forces of a massive financial ocean. He cautioned that Bitcoin’s volatility remains unpredictable, as the sheer size of the derivatives market can amplify its price swings.

Despite this turbulence, Keiser insists Bitcoin’s price trajectory remains predictable, arguing that it continues to move toward its long-term destination —one that many believe points higher.

Institutions Remain Bullish on BTC Despite Downturn

The commentary comes amid Bitcoin’s ongoing downturn, which pushed the asset down to a multi-month low of $88,526 yesterday. Several factors have contributed to the outcome, with outflows from Bitcoin ETFs standing out as a primary driver.

As reported yesterday, BlackRock’s iShares Bitcoin ETF (IBIT) logged its largest single-day outflow to date by selling $523 million in BTC. While other ETFs are also liquidating BTC at record rates, some institutional investors are increasing their exposure.

Recent regulatory filings show that the Abu Dhabi Investment Council (ADIC) tripled its Bitcoin holdings in the third quarter, boosting its IBIT shares to 8 million, up from 2.4 million.

Moreover, Michael Saylor’s Strategy continued its aggressive accumulation this week, announcing the purchase of more than 8,000 BTC on Monday. Further underscoring institutional conviction, El Salvador added 1,098 BTC to its portfolio, bringing its total holdings to 7,474 BTC.

Can Bitcoin Price Still Reach a New Peak?

Amid rising institutional investments, Cardano founder Charles Hoskinson predicted that Bitcoin would rebound from the current downturn and reach $250,000 next year. This represents an upsurge of 173% from the current price of $91,512.

Whales Begin Massive Bitcoin and Ethereum Accumulation as Fear Index Hits 2022 Lows

0

Whales have begun adding Bitcoin and Ethereum to their wallets even as the broader market shows strong signs of fear.

Their activity comes during a sharp drop in the sentiment index, which has returned to levels last seen in mid-2022.

Dormant Bitcoin Whale Resurfaces

According to Onchain Lens, a dormant Bitcoin whale became active again after a two-month hiatus. Specifically, the holder withdrew 544.25 BTC from Binance, an amount worth $49.84 million at the time of transfer. Following the withdrawal, the wallet’s total balance rose to 552.87 BTC, worth approximately $50.7 million.

Image

New Ethereum Whale Enters the Market

Meanwhile, the activity is not limited to Bitcoin. A separate report from Lookonchain revealed that a newly created wallet tagged 0x499f pulled 5,000 ETH from Binance through five transactions completed within hours. The acquired Ethereum is valued at about $15.04 million. The wallet now contains only 5,000 ETH and 100 USDC.

Image

Sentiment Index Drops to 3.5 Year Low

These purchases, however, stand in stark contrast to the prevailing market sentiment. The Fear & Greed Index currently sits at 10, placing it firmly in the “Extreme Fear” category. Notably, this is the lowest reading since July 2022.

Data from CoinGlass shows that the index last approached this territory during the 2022 bear market, when Bitcoin traded near $20,000.

Crypto Fear Greed Index

Generally, sentiment readings of this magnitude typically attract contrarian market participants. In other words, pronounced fear can create advantageous accumulation zones, whereas pronounced greed may indicate elevated risk.

Bitcoin Extends Decline Below $100,000 Mark

Meanwhile, market prices continue to reflect the strain. Bitcoin has now traded below the $100,000 psychological threshold for seven consecutive days. At the time of writing, BTC is at $91,947, showing a modest 0.69% daily gain but a 10% loss over the past week.

Similarly, Ethereum slipped under its $4,000 support level at the end of October and has remained below it since. ETH is trading at $3,009, down 2.2% today and 12.61% over the past week.

Overall, the continued weakness suggests that broader market uncertainty remains despite whale accumulation.

Whales Have Sold 190,000,000 XRP in 48 Hours as Price Stutters

0

Large holders continue to add pressure on the price of XRP, liquidating millions worth of the asset in the past two days.

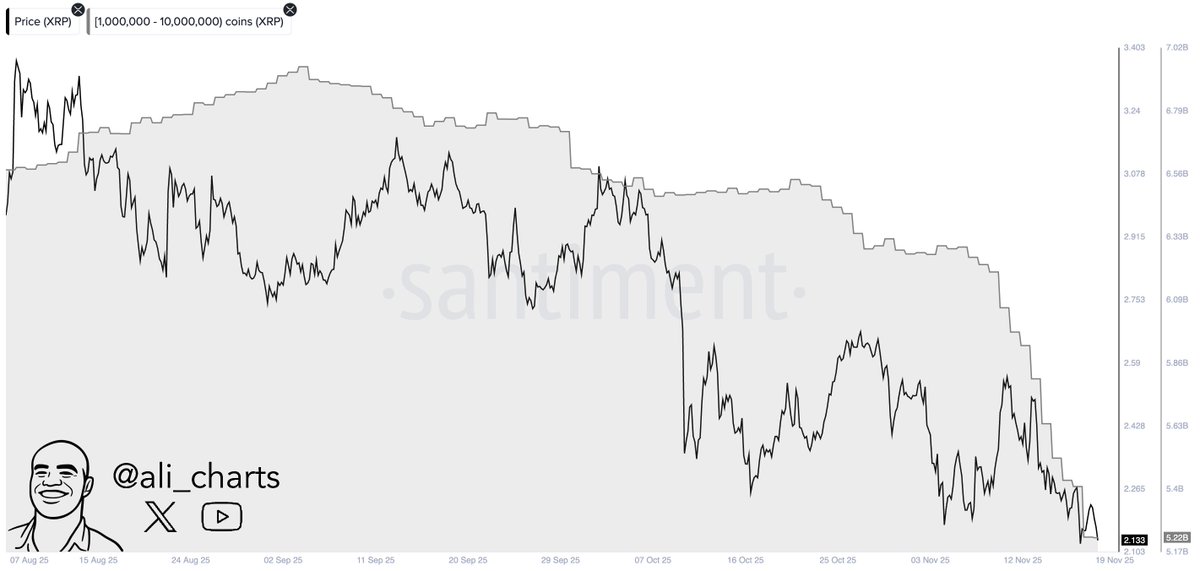
Prominent market analyst Ali Martinez highlighted this Santiment data in a social media post on Thursday. He shared that whales are still selling their stash, prioritizing safety amid broader market uncertainty.

For perspective, XRP has retraced slightly over the past 24 hours, but longer timeframes paint the entire picture. Iver the past week and month, the prominent cryptocurrency has collapsed by 14.6% and 13.1%, respectively, joining other major digital assets in the downtrend.

XRP Whales Exit Market

The report shows that, amid these declines, whales holding between 1 million and 10 million XRP tokens have continued to exit the market. Specifically, they have sold 190 million XRP, valued at $402 million at the current trading level, in the past 48 hours.

XRP Whales Sold 190M XRP in 48 Hours

Notably, these large XRP addresses have steadily reduced their market exposure since early September. They held over 6.8 billion tokens at the time but have sold over 1.58 billion XRP in two months. Data shows these wallets now hold a combined 5.22 billion XRP.

Meanwhile, a parallel report confirmed that these dumps have persisted for some time, confirming that XRP whales are offloading the coin at the rate of $50 million per day, adding to the skepticism among market traders.

ETF Inflows Boost Sentiment

Nonetheless, the performance of XRP’s first US spot ETF, the Canary Capital XRP ETF (XRPC), has boosted optimism among enthusiasts. The fund launched on November 13 and has since recorded no single-day net outflows.

Since the start of this week, XRPC has brought in $49.5 million, according to SoSoValue, bringing its cumulative total net inflow to $292.6 million.

Meanwhile, more XRP spot ETFs would enter the US market, with the Bitwise XRP ETF set to launch today, November 20. According to Bloomberg analyst James Seyffart, the Grayscale XRP ETF could debut on November 24, adding a new layer of liquidity and a channel for capital inflows into the XRP market.

Key XRP Levels to Watch

Meanwhile, Martinez highlighted key XRP price levels to watch if the bearish momentum continues. In a parallel tweet, he mentioned that with XRP currently below the $2.15 support, the next crucial demand zones lie at $1.91 and $1.73.

He identified this using the UTXO realized price distribution (URPD): percent-partitioned. Notably, reaching the lows would entail retracements of 10% and 18% from the current price.

Expert Says XRP Turn Could Be Fun as BTC Went from $40K to $126K After ETFs

0

Popular crypto commentator Zach Humphries suggests that XRP is gaining regulatory treatment akin to Bitcoin.

Accordingly, he argues XRP could see growth similar to BTC’s surge following its ETF launch. Humphries shared this perspective amid the imminent launch of the Bitwise XRP ETF (XRP) that has generated significant excitement within the crypto community. 

Bitwise confirmed that its XRP ETF will begin trading today on the NYSE, offering investors direct exposure to the underlying token. 

Amid this, Humphries emphasized the ETF’s importance, noting that XRP is gaining legitimacy and is now receiving regulatory treatment similar to that of Bitcoin and Ethereum. He noted that institutional investors can now access XRP without dealing with the complexities of exchanges or cold storage. 

XRP Could Mirror Bitcoin Rally? 

The pundit also highlighted the potential upside by drawing a parallel to Bitcoin’s market trajectory following the approval of its first spot ETF. 

In the commentary, Humphries noted that Bitcoin traded around $40,000 when the SEC authorized a wave of spot BTC ETFs in January 2024, and later surged to $126,000.

The approval of Bitcoin ETFs unleashed new demand for Bitcoin, enabling institutional capital to flow into BTC through the regulated investment vehicle and ultimately fueling a powerful rally.

Data from CoinMarketCap confirms that Bitcoin hovered around $47,000 when the SEC approved spot ETFs in January 2024. As demand for these products surged, Bitcoin’s price rose sharply. 

The apex crypto continued its rally, eventually reaching $126,000 last month. This represents an increase of 168% from Bitcoin’s price at the time the ETF launched.. 

Notably, Humphries believes that since Bitcoin’s price nearly tripled following the approval of multiple spot ETFs, XRP could experience similar growth as more spot ETFs tied to the token launch in the U.S. 

“This Will Be Fun” for XRP

He expressed excitement about XRP’s potential to attract institutional interest and replicate the price momentum seen with Bitcoin. “This will be fun,” he said. 

For context, if XRP were to achieve comparable growth of 168%, its price could rise from the current $2.12 to $5.68, a target that many analysts suggest could materialize as early as next year. 

Meanwhile, the Bitwise XRP ETF is set to become the second spot XRP ETF to launch in the United States, following Canary Capital’s fund. After Bitwise’s debut, ETFs from Grayscale, Franklin, and 21Shares are in line to launch this November 24.