Home Blog Page 56

XRP Posts Second-Highest RWA Inflow in Six Months, Adds $2.6B

0

The XRP Ledger has recorded the second-highest inflow of real-world assets over the past six months, as total value exceeds $4 billion.

XRP continues to expand its presence in the tokenized real-world asset (RWA) market as tokenization gains more traction this year. 

According to data from RWA.xyz, a leading platform that tracks tokenized RWA activity, the network attracted $2.6 billion in new RWA value over the past six months, excluding stablecoins.

This gives the XRP Ledger the second-largest RWA inflow among all blockchain networks during the period. Only BNB Chain recorded a higher figure, bringing in $3 billion over the same six months. Essentially, the XRPL has become one of the fastest-growing networks for tokenized real-world assets.

XRPL Outpaces Several Leading Blockchains

The latest figures also show that the XRP Ledger is one of only three blockchain networks to record more than $2 billion in RWA inflows during the past six months. Alongside BNB Chain and XRPL, Stellar ranked third with $2.1 billion, placing it about $500 million behind the XRP Ledger.

Several other major blockchain networks followed with lower inflows. Specifically, Solana took fourth place after attracting $1.6 billion, while Avalanche ranked fifth with $972 million, staying below the $1 billion mark.

XRP Sees Second Largest RWA Inflow

Although Ethereum remains the largest blockchain by total tokenized real-world asset value, it added only $424 million in RWA inflows over the past six months, putting it in sixth place for net inflows. 

Monad followed with $384 million, SEI recorded $252 million, and Provenance brought in $226 million, earning the seventh, eighth, and ninth spots, respectively. Meanwhile, Aptos, which completed the top ten, posted a $309 million outflow.

XRP Moves Up the Global RWA Rankings

The recent inflows have pushed the XRP Ledger’s total tokenized real-world asset value to $4.38 billion, making it the sixth-largest blockchain by total RWA value worldwide. The network sits just behind BNB Chain, which currently holds $5.2 billion in tokenized real-world assets.

The blockchains ahead of the XRP Ledger include Canton, Provenance, Ethereum, and Avalanche, which occupy the first through fourth positions, while BNB Chain ranks fifth. 

Total RWA Value by Network

Even with this rapid growth, the XRP Ledger still accounts for only 1% of the global $417 billion tokenized RWA market, which includes both represented and distributed assets.

Meanwhile, with stablecoins included, the XRP Ledger’s total RWA value rises from $4.38 billion to $5.376 billion, as the stablecoin market cap on the network has grown to $995 million with contributions from RLUSD and Braza assets.

XRP RWA Market Sees Accelerated Growth Throughout 2026

For context, the XRP Ledger started 2026 with less than $1 billion in tokenized real-world assets. As of Jan. 1, 2026, the network held $897 million in total RWA value.

The network grew exponentially during the first month of the year. By the end of January, its total RWA value had climbed past $1.8 billion. Over the next six months, it added another $2.6 billion, bringing the total to the current $4.38 billion.

Three major tokenized assets played a major role in this growth and now make up a large share of the XRP Ledger’s RWA market. These are Justoken’s JMWH energy product, which falls under commodities, CRX Digital Assets’ credit product, and Ripple’s RLUSD stablecoin.

Among them, JMWH remains the largest asset on the network. It is currently valued at $2.229 billion, representing 50.8% of the XRP Ledger’s total $4.38 billion RWA market.

Cardano Founder Warns Bitcoin Could Lose Top Spot Without Major Upgrades

0

Cardano founder Charles Hoskinson has warned that Bitcoin could eventually lose its position as the world’s largest cryptocurrency if it fails to adapt to quantum computing.

Speaking in an interview on The Starting Block, Hoskinson claimed that Bitcoin’s biggest weakness is its limited ability to implement major protocol upgrades. 

He argued that Bitcoin’s governance model makes significant network changes difficult, a challenge that could become critical as quantum computing advances and threatens today’s cryptographic security.

Quantum Computing Could Become Bitcoin’s Biggest Test

According to Hoskinson, Bitcoin has successfully overcome several external challenges throughout its history, including the disappearance of its pseudonymous creator, Satoshi Nakamoto.

However, he stressed that quantum computing represents a fundamentally different threat. Unlike previous challenges, quantum-resistant security would likely require coordinated, network-wide upgrades. If Bitcoin cannot organize and deploy those changes efficiently, Hoskinson believes it could eventually lose its dominance in the cryptocurrency market. 

For context, Bitcoin remains the world’s largest cryptocurrency by market cap, with a valuation of $1.28 trillion. 

Conversely, Hoskinson argued that Cardano was built to preserve Bitcoin’s original vision while addressing limitations that have emerged over time.

He described Cardano as Bitcoin’s “spiritual successor,” saying the blockchain solves issues that Satoshi Nakamoto could not fully address because of technical limitations and time constraints during Bitcoin’s early development.

On-chain Governance Gives Cardano Greater Flexibility

Hoskinson identified Cardano’s on-chain governance system as one of the network’s greatest strengths.

He explained that if quantum-resistant infrastructure becomes necessary, Cardano stakeholders could vote on the required protocol changes and execute the migration through the blockchain’s governance framework. 

According to him, this process would allow Cardano to respond more quickly and efficiently to future technological challenges than networks with more rigid governance structures.

Leios Upgrade Expected to Deliver Massive Performance Boost

Hoskinson also revealed that Cardano is preparing for its largest network upgrade to date. He said the enhancement is expected to increase the blockchain’s performance by 60x.

The upgrade he referenced is Ouroboros Leios, Cardano’s next-generation scaling protocol. Last month, developers launched Musashi Dojo, the Leios testnet, confirming that development is progressing as planned.

Meanwhile, the recent activation of the van Rossem hard fork (Protocol Version 11) laid the foundation for Leios, setting the stage for its anticipated mainnet launch later this year.

Hoskinson Proposes a Non-Custodial Way to Bring Bitcoin to Cardano

Beyond network upgrades, Hoskinson outlined a potential method for bringing Bitcoin liquidity into the Cardano ecosystem without relying on traditional blockchain bridges or triggering taxable events.

He explained that because both Bitcoin and Cardano use the Unspent Transaction Output (UTXO) accounting model, developers can leverage zero-knowledge cryptography to create a non-custodial mirror of Bitcoin on Cardano.

Under this approach, Bitcoin holders would retain ownership of their BTC while accessing Cardano-based decentralized applications without transferring their assets to a third-party bridge.

Hoskinson argued that this model would significantly improve security by eliminating the risks associated with cross-chain bridges, which have historically been among the most frequent targets of cryptocurrency exploits. 

He also emphasized that the process would remain tax-neutral because it does not involve creating a new asset or selling Bitcoin. Instead, users would continue holding their original BTC while securely participating in Cardano’s ecosystem through zero-knowledge technology. 

Hoskinson Says Cardano Treasury Can Fund $100M+ Ecosystem Growth This Year Despite ADA Decline

0

Cardano founder Charles Hoskinson has argued that the network remains financially strong despite its recent decline in the cryptocurrency market rankings. 

According to him, Cardano’s on-chain treasury continues to generate enough funding to support the ecosystem’s long-term growth. 

Speaking during an interview on The Starting Block, Hoskinson acknowledged that Cardano’s market cap has fallen to around $6 billion, pushing the cryptocurrency out of the top 10 by market value. Nonetheless, he stressed that the network still has sufficient financial resources to fund more than $100 million in ecosystem development this year.

Treasury Generates Funding for Ecosystem Development

Hoskinson explained that Cardano’s treasury is financed through the blockchain’s economic model, which channels a portion of network revenue and protocol inflation into an on-chain treasury. Through Cardano’s governance system, the community can then vote on how those funds are allocated to support the ecosystem.

According to him, the treasury can finance a budget exceeding $100 million this year. The funding could support a wide range of initiatives, including software development, infrastructure upgrades, research, developer tools, educational programs, and other projects designed to strengthen the Cardano network.

Dozens of Companies Already Receiving Treasury Funding

Hoskinson also emphasized that the treasury is already delivering tangible results. He revealed that more than three to four dozen companies have received funding from Cardano’s treasury to contribute to the ecosystem.

These independent organizations are building products, enhancing the protocol, developing decentralized applications, and expanding Cardano’s infrastructure. As a result, the network no longer depends solely on Input Output Global (IOG), the company that originally developed Cardano, to drive innovation. 

Although Hoskinson did not identify the funded organizations during the interview, several treasury allocations are publicly known.

Notably, Input Output Global (IOG) is among the beneficiaries. Earlier this year, the company submitted nine separate treasury proposals seeking nearly $50 million in funding, with only a few proposals failing to secure community approval.

Meanwhile, EMURGO received approximately $793,000, equivalent to 3.3 million ADA, to oversee Cardano’s presence at the TOKEN2049 conference. However, that responsibility has since been transferred to the Cardano Foundation after EMURGO stepped down from Pentad.

Hoskinson Expects Cardano to Return to the Top 10

Despite its financial strength, Cardano remains outside the cryptocurrency market’s top 10. The digital asset currently ranks as the 16th-largest cryptocurrency, with a market capitalization of approximately $5.89 billion and a trading price of $0.1616. 

Cardano Ranking on CoinMarketCap

Even so, Hoskinson remains optimistic that Cardano will regain a top-10 position before the end of the year. Whether that prediction materializes, however, remains uncertain as the broader cryptocurrency market continues to evolve. 

Bitcoin Long-Term Holders Just Bought More BTC Than at Any Time Since 2017. What’s Next?

Bitcoin long-term holders (LTHs) accumulated BTC at the fastest pace in six years, according to CryptoQuant analyst Burakkesmeci. 

The trend suggests fresh confidence among experienced investors despite recent price weakness. On-chain data shows the LTH Net Position Change—a metric that tracks the 30-day increase or decrease in Bitcoin held by long-term investors—reached 1.29 million BTC on May 24, 2026. That surpassed the previous record set in August 2017.

Record Accumulation During Market Weakness

Burakkesmeci explained that the indicator tracks whether long-term holders are adding to or reducing their Bitcoin positions. Green readings signal accumulation, while red readings indicate distribution.

He said the latest record green reading suggests that “smart money” accumulated aggressively as Bitcoin approached its realized price during the market downturn. According to Burakkesmeci, buying at this scale reflects strong conviction despite the recent decline.

Source: CryptoQuant
Source: CryptoQuant

Bitcoin Rebounds After Buying Spree

Burakkesmeci cautioned that the indicator alone does not confirm the start of a new bull market. However, he described it as a strong bullish signal.

After the record accumulation, Bitcoin climbed about 15%, rising from roughly $58,000 to $66,000. The rally pushed the cryptocurrency close to the Short-Term Holder Realized Price (STH RP) of around $68,000.

The analyst identified $68,000 as a key resistance level. A breakout above it during the third quarter could strengthen Bitcoin’s short-term outlook.

At press time, Bitcoin traded at $63,973 after falling 2.5% over the past 24 hours. Despite the pullback, it remained up 3.5% over the past month.

Another CryptoQuant Metric Shows Investor Repositioning

In a separate analysis, CryptoQuant contributor Nino pointed to rising exchange inflows from Bitcoin held for six to 12 months. He observed a noticeable increase in Exchange Inflows within the 6M–12M Spent Output Age Bands. Volatility in the cohort’s market dominance also increased.

According to Nino, the movement of these mid-term holdings onto exchanges may indicate investors are rebalancing or repositioning their portfolios ahead of the market’s next phase.

While the inflows do not necessarily signal immediate selling pressure, they may be strategic positioning as Bitcoin approaches a critical technical level.

Supply in Profit Improves as Recovery Continues

The accumulation trend also aligns with signs of improving on-chain conditions. A separate CryptoQuant analysis found that Bitcoin’s Supply in Profit rose to 57.5% from 46.2% over the past three weeks, indicating that a growing share of BTC holders has returned to profitability.

However, previous bear markets ended only after at least 64% of Bitcoin’s supply returned to profit. With the metric currently at 57.5%, the market may still be in a recovery phase rather than a confirmed new bull cycle.

XRP Descending Channel Highlights Possible Area Where the Downtrend Could End

0

XRP currently trades within a descending channel pattern that suggests the downtrend may continue to new lows before a rebound could occur.

The broader crypto market has remained stuck in a downward trend, as selling pressure persists across the board. Since hitting the $3.6 all-time high in July 2025, XRP has continued to slide lower, now changing hands at $1.08. This represents a 70% decline from the peak.

XRP Trading Within Descending Channel

Notably, the downward price action has resulted in a series of lower highs and lower lows over the past year, leading to the formation of a descending channel pattern on the daily chart.

For the uninitiated, a descending channel is a pattern where an asset moves between two parallel downward-sloping trendlines. In this case, the upper trendline acts as resistance, while the lower trendline acts as support.

The pattern often plays out during a consistent downtrend, as prices continue to drop lower. With both trendlines sloping downward, the asset persistently witnesses resistance and lower highs and support at lower lows until a breakout above the upper trendline occurs.

Collapsing Resistance and Support Levels

Since XRP slipped into the channel in July 2025, all efforts to break out have met resistance at the upper trendline. Meanwhile, buyers have continued to defend against any attempt to breach the lower trendline. 

The first attempt at a breakout came up in early October 2025, when XRP jumped to a high of $3.10. It faced resistance at this area, which aligned with the upper trendline, and a pullback ensued, eventually leading to a drop to $1.27 during the Oct. 10 market-wide crash.

Another breakout attempt played out during the January 2026 recovery push, as XRP soared to a high of $2.41, which aligned with the upper trendline. However, bears triggered a pullback, which eventually dragged XRP to a low of $1.1 by early February 2026.

XRP Descending Channel

Buyers stepped in again at this low and defended the support around the lower trendline. Since then, XRP has failed to jump toward the upper trendline or drop toward the lower trendline, trading around the midpoint of the channel for five months now.

Possible XRP Drop to $0.8

Now, the XRP price seems to be gravitating toward the lower trendline after the drop from the $3.6 high earlier this week. If the broader market experiences renewed selling pressure, XRP may record steeper declines to find support at the trendline.

Notably, this would involve a drop to the $0.8 to $0.9 price range, specifically around $0.84, representing a decline of 22% from the current price of $1.08. This would also mark a 76% crash from the $3.6 peak, consistent with previous drawdowns XRP has recorded from past cycles.

If buyers defend this level, the $0.8 area could mark XRP’s bottom for this ongoing downtrend. Analysts such as Chart Nerd and Casi Trades have already suggested this. A recovery from here could help buyers breach the upper trendline of the channel, eventually pushing XRP above the $2 price level.

Dormant Shiba Inu Whale Ends Seven-Month Silence With 30 Billion SHIB Purchase From Binance

0

A previously inactive Shiba Inu whale has resumed accumulating the token after spending more than seven months on the sidelines. 

According to on-chain data from Arkham Intelligence, the whale recently purchased 30.18 billion Shiba Inu in a single transaction valued at $125,270. The transaction quickly attracted the attention of the Shiba Inu community, as it marked the whale’s first significant purchase in months.

Latest Purchase Lifts Holdings to 50.28 Billion SHIB

Before the latest acquisition, the whale had not bought any SHIB for over seven months. The previous purchase occurred in December 2025, when the address acquired 70 million SHIB. A month earlier, the same wallet accumulated more than 20 billion SHIB through four separate transactions. 

Whale Resumes Shiba Inu Accumulation With 30 Billion SHIB Purchase

Following the recent purchase, the wallet’s holdings have increased to 50.28 billion SHIB, currently worth $210,710. SHIB also remains the largest asset in the wallet by dollar value, highlighting the investor’s continued conviction in the token.

Accumulation Coincides With Exchange Outflows

The whale’s renewed buying activity comes as investors continue removing SHIB from centralized exchanges. As previously reported, holders withdrew roughly 74 billion SHIB from exchanges, signaling a preference for self-custody.

The trend has continued over the past 24 hours, with investors withdrawing more than 1 billion SHIB, further reducing the amount of the token available on trading platforms.

At the same time, leading cryptocurrency exchanges have been reshuffling billions of SHIB between their wallets. Over the past 12 hours, OKX transferred more than 168 billion SHIB from its hot wallet to cold storage. 

Meanwhile, Binance and Wintermute also moved billions of SHIB in separate transactions over recent hours. Such transfers are typically associated with internal wallet management and do not necessarily indicate buying or selling activity.

SHIB Regains Momentum

Amid the renewed whale accumulation and continued exchange outflows, Shiba Inu has regained some momentum in the broader crypto market.

The token has reclaimed its position as the 31st-largest cryptocurrency by market cap. At the time of writing, SHIB was trading at $0.000004211, up 0.69% over the past 24 hours and 1.38% over the past seven days. 

While the recent whale activity has sparked optimism among investors, it remains too early to determine whether it signals the beginning of a sustained recovery. 

Ethereum Price Is Cooling, but Its Network Is Waking Up: 5 Key Metrics

The recent Ethereum (ETH) price rally has lost momentum, but five key on-chain metrics suggest the network may be entering the early stages of a recovery.

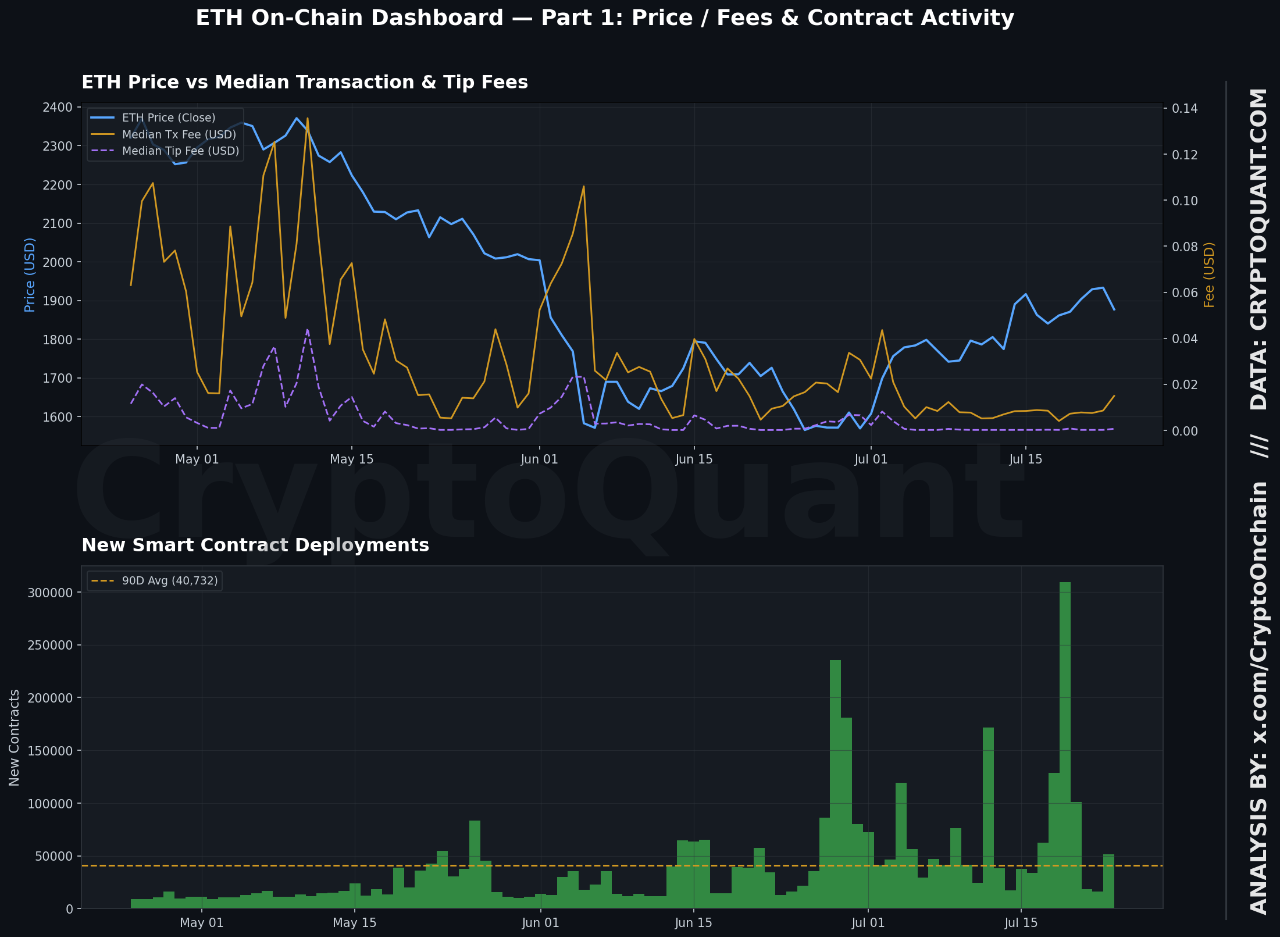
After climbing from $1,796 to a recent high of $1,933, Ethereum retraced to around $1,876 on July 23. While the price has stalled, on-chain data from CryptoQuant indicates that activity on Ethereum’s base layer is showing early signs of improvement.

Ethereum Fee Activity Begins to Rebound

For much of the past three months, Ethereum’s fee environment has remained subdued. Median transaction fees have stayed more than 82% below their 90-day average, while median priority (tip) fees have been roughly 96% lower than normal.

However, short-term data paints a different picture. Over the past week, median tip fees surged nearly 86%, while median transaction fees increased by approximately 16%.

Although these gains come from historically low levels, they mark the first meaningful increase in fee pressure after an extended period of weakness. The uptick suggests that competition for block space may be returning after months of subdued activity.

ETH dashboard | CryptoQuant

Smart Contract Deployments Remain Strong

On-chain development activity also remains strong. New smart contract deployments are running nearly 190% above their 90-day average, suggesting that developers continue to build on the network. Combined with rising transaction fees, this trend may indicate organic demand rather than speculative trading activity.

Ethereum Leverage Cools as Exchange Flows Shift

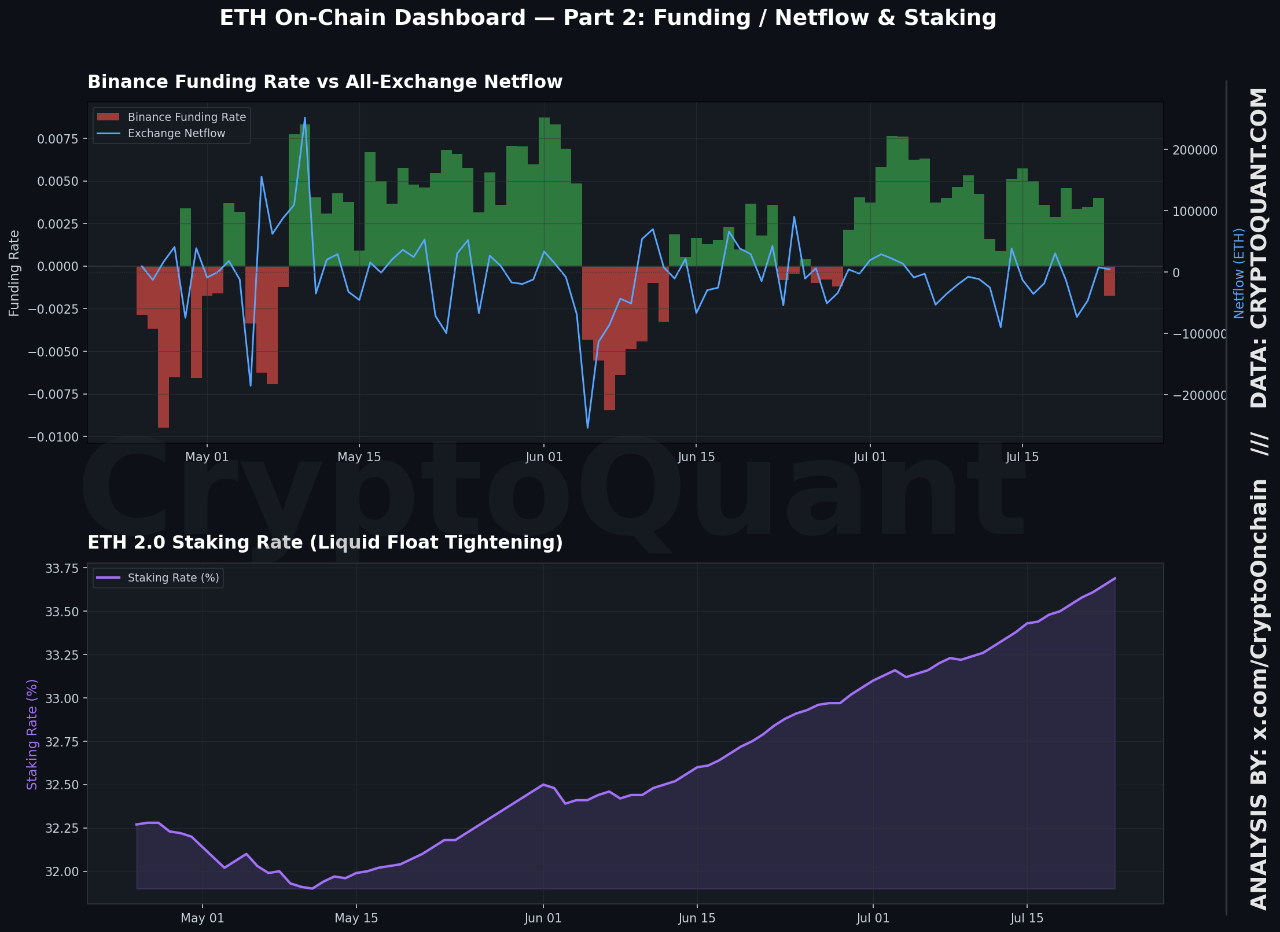
Derivatives data presents a more cautious outlook. Binance funding rates declined by around 28% week over week. The decline suggests that leveraged trading is not the primary driver behind Ethereum’s recent price action.

At the same time, exchange flows shifted from a net outflow of approximately 73,000 ETH on July 20 to modest inflows as Ethereum reached its recent peak before pulling back.

Ethereum dashboard | CryptoQuant

Staking Reaches a New High

Meanwhile, Ethereum staking continues to expand, reaching a new high of 33.69% of the total supply. The increase further reduces the amount of ETH available for trading in the liquid market.

658,600 ETH Leaves Exchanges, Tightening Liquid Supply

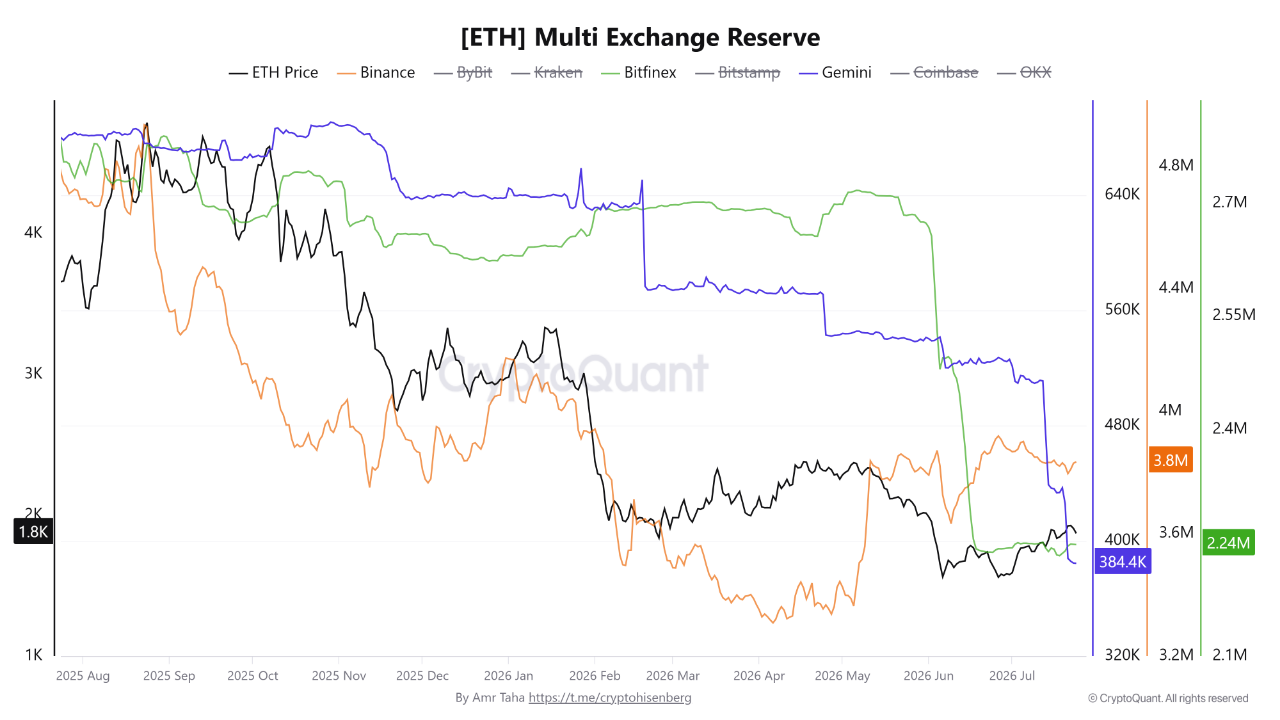
Beyond staking, Ethereum’s liquid supply on exchanges is also continuing to shrink. Around 658,600 ETH, worth approximately $1.24 billion, has left Gemini and Bitfinex, reducing the amount of ETH immediately available for trading.

Gemini’s reserves fell to 384,400 ETH, the lowest level since March 2024, after losing about 188,600 ETH since April. Bitfinex saw a larger decline of roughly 470,000 ETH since May, while Binance holdings remained steady at around 3.8 million ETH.

Lower exchange balances may reduce selling pressure, though they do not guarantee future price movements. Combined with rising fees and smart contract activity, the trend points to improving Ethereum market conditions.

Overall, Ethereum’s network data shows steady improvement despite the recent price decline. Rising fee activity, strong smart contract growth, record staking levels, fewer coins on exchanges, and lower leverage suggest that the market’s strength is being driven more by genuine network usage than speculation.

XRP Reserve on Upbit Collapses to 2-Month Low of 6.4B

0

The XRP exchange reserve on Upbit, Korea’s largest crypto trading platform, has declined to a new 2-month low amid consistent withdrawals.

Notably, XRP remains under selling pressure as the broader market downturn pushes the token to $1.08, leaving it down 70% from its previous peak. While the price continues to struggle, on-chain data shows that the amount of XRP held on exchanges has also declined. 

Upbit Records Its Lowest XRP Reserve Since May

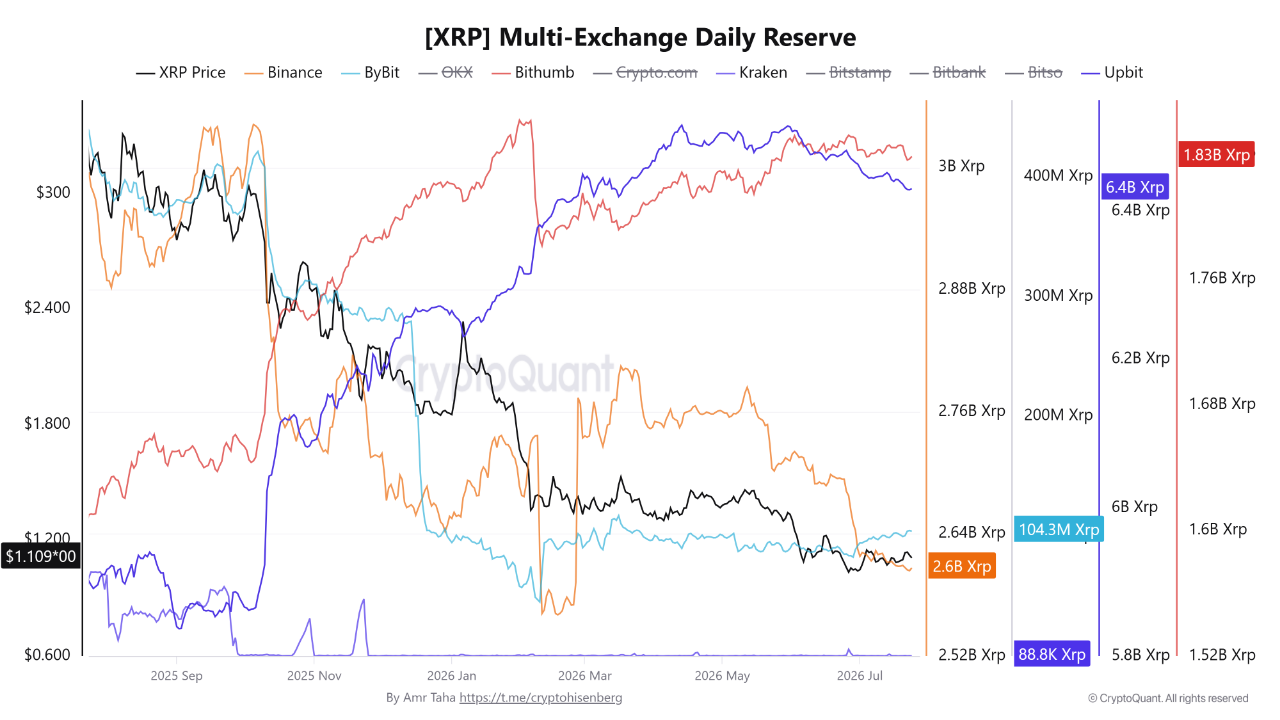
The latest data shows that Upbit’s XRP reserve has dropped to about 6.43 billion XRP, its lowest level since May.

The exchange last reached a recent high of roughly 6.515 billion XRP on May 30. Since then, its holdings have fallen by around 85 million XRP, marking a decline of about 1.3% from that peak.

Even after this drop, Upbit still holds much more XRP than the other exchanges included in the data. With approximately 6.43 billion XRP, the exchange currently holds about 2.47x as much XRP as Binance, confirming its large share of the exchange reserves.

Binance and Bithumb Move in Different Directions

Meanwhile, Binance has also seen a drop in its XRP holdings. The exchange held about 2.60 billion XRP on July 24, compared with its 2026 high of roughly 2.80 billion XRP recorded on March 17.

XRP Multi Exchange Reserve CryptoQuant
XRP Multi Exchange Reserve | CryptoQuant

This means Binance’s reserve has fallen by around 200 million XRP, or about 7.1%, from its March peak.

However, Bithumb has followed a different path. Specifically, its XRP reserve now stands at approximately 1.83 billion XRP, putting it close to the level it recorded on May 30. 

Essentially, the latest figures show three different trends. Notably, Upbit has fallen to a multi-month low, Binance remains well below its March high, while Bithumb has returned to nearly its late-May reserve level.

It is important to note that a decline in exchange reserves does not automatically explain where the tokens have gone. The data does not show whether holders moved XRP into self-custody, transferred it to other exchanges, or shifted it through other market channels.

Sellers Regain Control of XRP Price

Alongside the reserve data, XRP’s recent price action suggests that sellers have regained control after the token failed to hold above its recent $1.16 local high reached on July 21.

Since hitting that level, XRP has posted three straight intraday losing candlesticks and remains on track to record a fourth consecutive daily loss. At its current price of $1.08, the token has fallen by nearly 7% from the July 21 high.

Momentum indicators also show weakening buying strength. On the daily chart, the Relative Strength Index (RSI) has continued to decline after reaching 56.78 on July 22. The indicator now stands at 45.18, showing that bullish momentum has weakened over the past few trading sessions.

If sellers keep control of the market, XRP could revisit the July 13 low near $1.05, where the token previously found initial support. This possibility comes as exchange reserves continue to move lower.

Meanwhile, XRP has traded inside a descending channel since July 2025. The pattern could eventually push the token toward the channel’s lower trendline in the $0.8 to $0.9 range. This area may provide support, mark the cycle bottom, and set the stage for a recovery that ends the current downtrend.

HYPE Whales Move $400M in Days: Is a Sell-Off Coming or Something Bigger?

Hyperliquid (HYPE) whales are making massive on-chain moves even as the token trades well below its recent all-time high. 

Wallets have staked and unstaked hundreds of millions of dollars worth of HYPE in the past few days.

Yesterday, blockchain tracker Lookonchain reported that one whale staked 2.93 million HYPE, worth about $172 million. The tokens came from 19 wallets believed to belong to the same entity, which deposited them into Hyperliquid over the past 24 hours.

According to the data, the whale accumulated the 2.93 million HYPE about nine months ago at an average price of $44 per token. At current prices, the position is sitting on an unrealized profit of roughly $44.5 million.

Lookonchain also flagged another major transaction. A separate whale received 557,902 HYPE, valued at around $32.87 million, from institutional trading firm FalconX. The tokens were then deposited into Hyperliquid for staking.

$170M Unstaking Raises Questions

Meanwhile, OnChain Lens reported that a single entity unstaked 2.92 million HYPE, worth about $170.1 million, from two wallets. The tokens had remained staked for roughly eight months, and both wallets now hold no HYPE in the staking contract.

The tracker later identified another large staking transaction involving 1.49 million HYPE, worth about $88.2 million. The tokens were spread across eight wallets.

Image

Image

On-chain data shows those wallets acquired their HYPE through Bybit around nine months ago. They held the tokens until the recent staking activity.

ETF Seeding Theory Gains Traction

The large unstaking activity sparked speculation that major holders were preparing to sell. However, Hyperliquid community member Grenderen.hl offered a different explanation.

According to him, the activity could be linked to ETF seeding rather than liquidation. Custodians need liquid tokens for ETF operations, making staked HYPE unsuitable.

Grenderen pointed to a similar event in April. Around $88 million worth of HYPE was unstaked on the same day Grayscale updated a filing and switched custody to Anchorage.

$400M Set to Leave Staking

Crypto commentator Jussy estimated that about $400 million worth of HYPE is scheduled to leave staking over the next seven days.

The analyst said more than 5 million HYPE, worth roughly $320 million, is tied to wallets linked to Multicoin, Paradigm, and Selini Capital.

Multicoin has said its unstaking is part of a wallet rotation, not a sale. Paradigm and Selini Capital have not made similar statements.

Jussy also noted that HYPE previously fell 15% after unstaking announcements triggered market panic. At that time, around 3.2 million HYPE entered the unstaking queue, including about 2 million HYPE linked to Multicoin’s wallet rotation.

The analyst added that if the remaining tokens are sold gradually, Hyperliquid’s reported $1.4 million in daily buybacks could help absorb some of the selling pressure.

HYPE Stays Below Its Peak

According to CoinMarketCap data, HYPE traded at $57.65, down 1.44% over the past 24 hours. The token has fallen about 9% over the past month and remains roughly 25% below its all-time high of $76, reached about a month ago.

The recent wave of whale staking and unstaking has left traders divided. Some see the activity as a sign of potential selling pressure, while others believe it is strategic institutional positioning. 

Current XRP Downtrend Resembles Triangle Setup That Led to 66,000% Surge in 2017

0

XRP could be repeating the same price pattern that came before its massive rally in the 2017/2018 market cycle. 

Latest market data suggests the asset is again moving within a symmetrical triangle, similar to the structure that eventually led to a remarkable 66,000% gain and pushed XRP to $3.31 nine years ago.

The first version of this symmetrical triangle played out over several years. Specifically, it started after XRP fell from its $0.0614 high in December 2013 and continued until the breakout in March 2017. 

Once XRP broke above the pattern, an impressive rally ensued. The token climbed more than 66,000%, rising from around $0.005 in March 2017 to a peak of $3.31 in January 2018.

XRP Has Formed A Bigger Triangle

The current symmetrical triangle is larger and took much longer to develop than the previous one. Unlike the first pattern, this one has formed over an entire market cycle.

This second triangle started forming after XRP dropped from its $3.31 peak in January 2018. The asset remained inside the pattern for years before finally breaking above the upper resistance line. 

XRP broke above the triangle’s main resistance line during the Trump-led November 2024 rally. The breakout triggered a strong move higher, sending the asset from about $0.5 to $3.4 by January 2018. After the rally, XRP pulled back before climbing again to a new all-time high of $3.6 in July 2025.

XRP Triangle Structure

Notably, the rally did not continue immediately after reaching that peak. Instead, XRP entered a deep correction that brought it back toward the previous breakout area and rising macro support. This phase represents an important test of the long-term structure, as XRP currently remains in this broader downtrend.

RSI Shows Oversold Conditions

Despite the ongoing weakness, one key momentum indicator has moved into an area that previously marked strong accumulation zones. 

Notably, the monthly Relative Strength Index (RSI) has dropped into oversold territory at 41.85, near levels where XRP has historically attracted long-term buying interest.

Currently, the price remains weak, market sentiment has become exhausted, and much of the previous rally has faded. 

However, the broader breakout structure has not been invalidated. Importantly, traders should prepare for continued volatility, more testing of support, and a difficult path back upward instead of an immediate recovery.

History Suggests a Key Support Level

XRP’s current situation resembles what happened after the March 2017 breakout. Following that breakout, XRP dropped to $0.0075 in April 2017. The sudden decline brought the price back to the upper trendline of the triangle, allowing it to complete a successful breakout retest.

After finding support there, XRP resumed its rally and eventually reached $3.31 by January 2018. If buyers defend the present support area this time, the decline could become a normal post-breakout reset instead of the beginning of a larger structural breakdown.

The most important support zone now sits between $0.70 and $0.83, with $0.82 standing out as the key level. This area lines up with the upper trendline of the symmetrical triangle. Holding above that range would help XRP stay above the breakout level and keep the long-term bullish structure intact.