Home Blog Page 764

Bitcoin Dominance Hits New 4-Year Peak: Here’s What This Means for the Altcoin Season

Bitcoin dominance has claimed a high last seen in the previous bull run, leading to discussions around a potential altcoin season.

Notably, Bitcoin dominance surged to a new four-year high, reaching 64.94% today, May 2. This peak, the highest since January 2021, is a product of Bitcoin’s recent strong performance. 

Bitcoin Dominance up 13% Since December 2024

Specifically, since April 21, Bitcoin’s price has climbed from $85,197 to a peak of $97,470 on May 1, maintaining levels above $97,000 at the time of writing. This price surge, along with relatively slower growth in altcoins, has boosted Bitcoin dominance. 

Nonetheless, this builds on an uptrend that has persisted since last December. The dominance rate has risen from 57.22% in December 2024, gaining over 13% in five consecutive months. 

However, this rise has now brought Bitcoin dominance into a historically significant resistance zone around the 65% mark. In the previous bull market of 2021, dominance at this level triggered a sharp reversal. 

Back then, Bitcoin dominance touched a near four-year high of 73.63% in early January 2021 but quickly fell, closing the month at 63.09%. 

Interestingly, February 2021 saw a short-lived rebound to 64.83%, but resistance held firm, and dominance eventually plummeted to 39.56% by September 2021. That drop, which lasted for over seven months, coincided with the explosive growth of altcoins, leading to the altcoin season.

What the Recent Bitcoin Dominance Peak Means for Alt Season

Now, Bitcoin dominance is again testing that barrier. The monthly Relative Strength Index (RSI) for dominance has reached an all-time high of 72.22, signaling overbought conditions. Historically, such levels have preceded pullbacks. 

Bitcoin Dominance 1M Chart

If Bitcoin dominance fails to break this resistance, a correction could ensue. The first significant support lies at the 0.786 Fibonacci retracement level of 59.35%, followed by the next major support at 54.97%. 

If this level also falters, dominance could retreat toward the 48.81% region, aligning with the 0.382 Fibonacci level. A pullback of this magnitude would likely translate to the long-anticipated altcoin season, during which altcoins outperform Bitcoin.

Analysts Expect Imminent Altcoin Season

Several prominent analysts have discussed the potential turning point for altcoins. For instance, Michaël van de Poppe, the founder of MN Consultancy, has been vocal about the resilience and prospects of the altcoin market. 

On April 16, he noted that the altcoin season index had reached its lowest point in two years, coinciding with a sharp drop in the fear and greed index. He emphasized that market sentiment felt grim, which he viewed as a contrarian indicator that shows a potential turning point toward recovery.

Three days ago, van de Poppe observed that the total market cap of altcoins was maintaining strength and had recently confirmed a successful retest. He suggested that this development laid the foundation for a move toward new all-time highs. 

Meanwhile, pseudonymous trader Ak47 recently highlighted how the approval of altcoin-based ETFs in 2025 could contribute to the altcoin season. For context, according to Bloomberg Intelligence estimates, Litecoin and Solana have a 90% likelihood of ETF approval, while XRP stands at 85%. 

Dogecoin and Hedera Hashgraph are forecasted at 80%, and Polkadot, Cardano, and Avalanche each carry a 75% chance. These projections have triggered expectations for a robust altcoin season if these ETF products eventually secure approval.

Also, Crypto Tamil, another analyst, discussed the BTC.D chart today. He pointed out a bearish divergence on the daily Bitcoin dominance chart and argued that the metric is nearing its peak. He asserted that the conditions are favorable for a full-fledged altcoin season.
Expert Explains How Hidden Dark Pools May Be Absorbing XRP Buy Pressure

A well-known XRP community commentator, posting under the handle “All Things XRP,” recently dismissed claims that dark pools do not exist for XRP.

For the uninitiated, dark pools are private, off-exchange trading venues typically used by institutions. Within these hidden markets, whales can accumulate large amounts of crypto assets without alerting retail investors or triggering volatility. Essentially, it helps them to avoid causing dramatic price movements.

In his latest commentary, All Things XRP emphasized that such entities exist in the XRP ecosystem, suggesting they are secretly accumulating the token behind the scenes. The recent post comes on the back of doubt expressed by some in response to an earlier report he made on this.

The analyst noted that dark pools were originally used in traditional finance to avoid slippage and market disruption. He claimed that platforms like Kraken and sFOX reportedly offer dark pool-style trading features that likely include XRP. Even Coinbase is rumored to provide similar services, though this remains unconfirmed.

The XRP Price Mystery

Despite significant positive catalysts, such as the launch of Brazil’s first XRP ETF and Ripple’s $1.25 billion acquisition of Hidden Road, XRP’s price has remained flat for most of 2025. From January to the present, XRP has held steady around $2, occasionally dipping below.

According to proponents of the dark pool theory, this price behavior aligns perfectly with the idea of hidden institutional accumulation. They believe there is a strong possibility that XRP buy pressure is being absorbed out of sight, with repeated patterns of muted market responses following bullish events.

“95% Confidence”

Notably, All Things XRP cited several indicators to support the dark pool theory. He specifically noted that XRP trades on platforms known to support private institutional trading. He also claimed that recent price activity shows signs of accumulation without corresponding retail momentum.

Moreover, he cited academic research indicating that dark pools can suppress short-term price discovery, a pattern that mirrors XRP’s historical performance. According to him, this should not be considered a coincidence.

While direct confirmation from any reputable source is still lacking, the mounting circumstantial evidence has led many analysts to express near certainty. In particular, All Things XRP stated his confidence in the theory is as high as 95%.

Ripple’s Silence Fuels Speculation

Moreover, he claimed that the key reason the debate persists is Ripple’s silence on the matter. The company has neither confirmed nor denied the existence of dark pool activity involving XRP. However, Ripple might not be in a position to comment on this, given that decentralization confirms that institutions can engage in such trading activities without their knowledge.

Interestingly, a petition on Change.org has gathered over 300 signatures, demanding transparency from Ripple regarding institutional trading practices. So far, there has been no official response. It is worth noting that the company regularly issues quarterly reports on XRP markets.

Why Retail Investors Should Pay Attention

If institutional investors are quietly accumulating XRP via dark pools, retail investors may be underestimating the asset’s true demand, according to All Things XRP.

He believes it could explain why XRP appears weak on the charts despite major milestones. Speculators suggest that once this hidden demand hits public order books, the price impact could be explosive.

While the theory remains unconfirmed, it’s enough to raise a red flag for many in the XRP community, particularly those who believe the real XRP market may be far deeper than it appears.

Top Analyst Shares Dogecoin Road to $10, Calls Holders ‘Absolute Legends’

0

A recent Dogecoin chart by analyst “Steph is Crypto” highlights that DOGE continues to hold a rising trendline, with the latest bounce indicating renewed bullish momentum.

Dogecoin’s recent price action reflects resilience despite a brief bearish dip. After dropping from a high of $0.19 to a low of $0.16 earlier this week, the coin swiftly rebounded to around $0.185, signaling renewed buying interest at lower levels.

Analysts have since identified multiple structural price levels that continue to guide Dogecoin’s trajectory across various timeframes.

Dogecoin Road to $10

For instance, a chart from Steph highlighted a significant long-term rising support line, labeled the “Legendary trend-line.” 

This trendline connects three major price lows over several years. It started in early 2020 above $0.001, followed by a touchpoint above $0.06 in 2024, and most recently at approximately $0.13 in 2025. At each of these levels, the price bounced, suggesting consistent defense of this trendline.

The support level around $0.13 marked the most recent contact with the trendline, which preceded the latest price recovery. Notably, Dogecoin has not breached this line during any of the recent market cycles.

According to the same chart, the formation indicates the potential for a long-term rally, with a speculative price target of $10. This would represent a 5,440% increase from the current price level. According to Step, those still holding DOGE are “absolute legend.”

A More Conservative Outlook

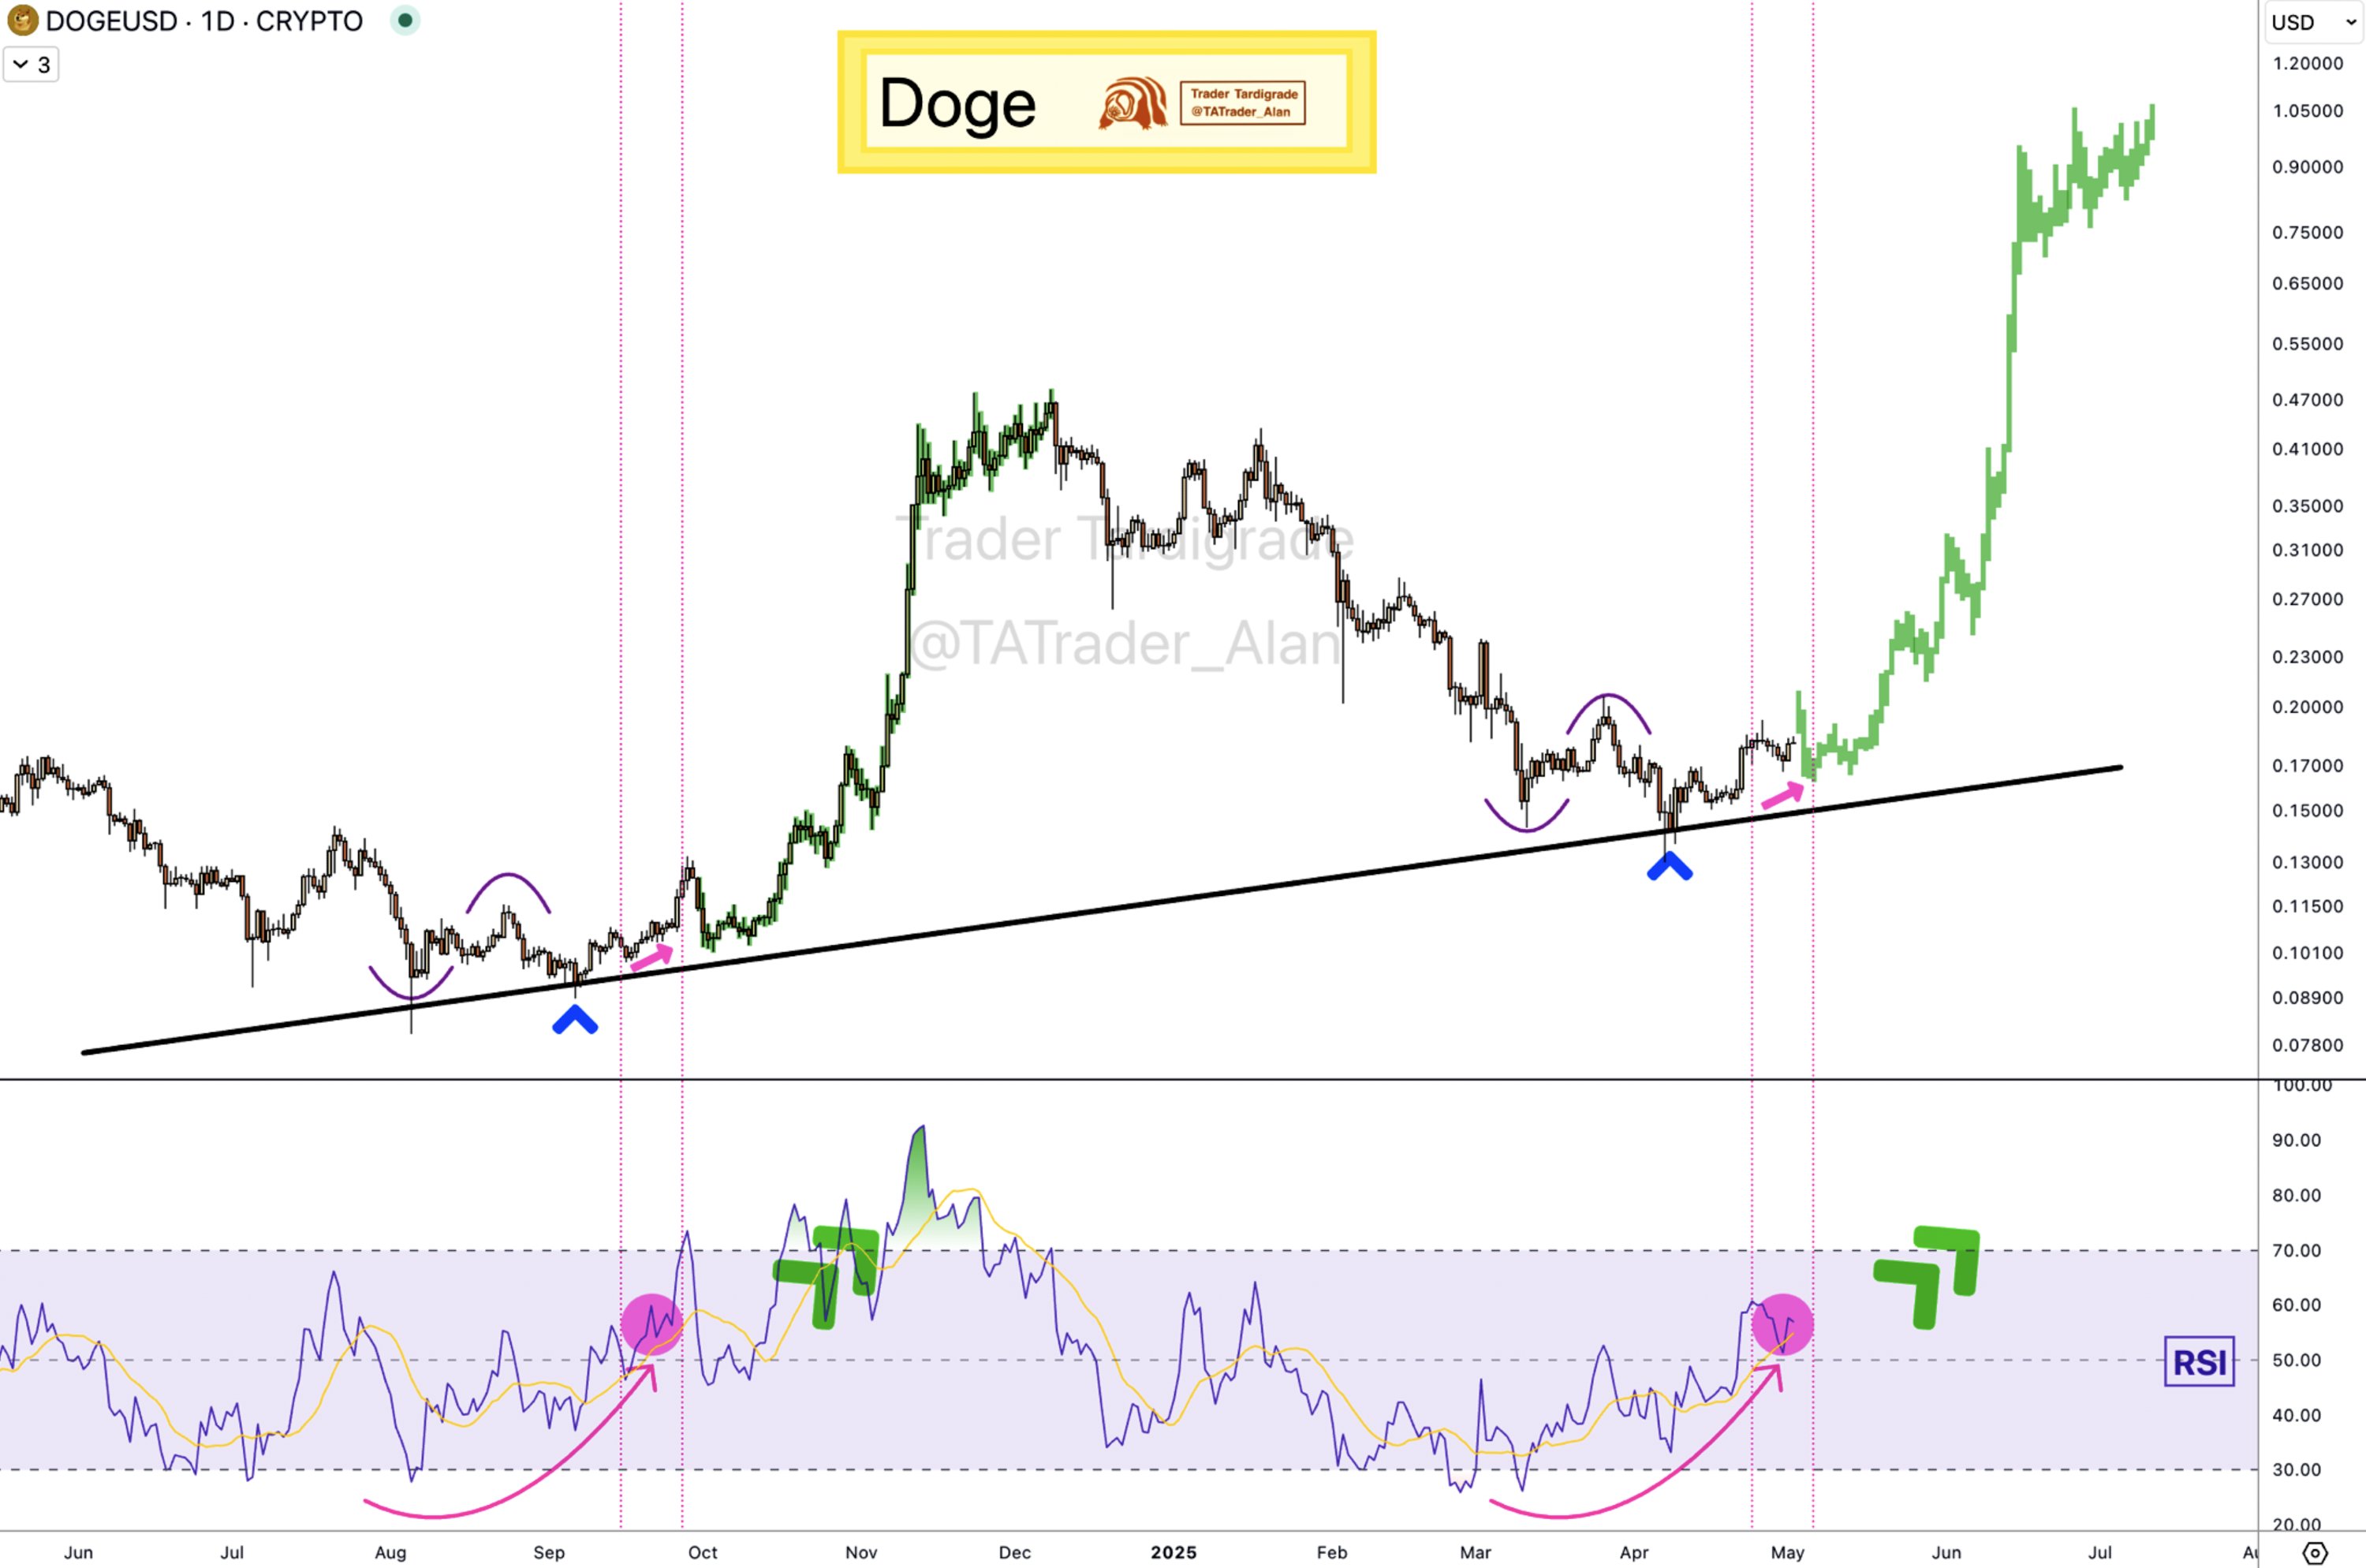
On a separate note, chart data from Trader Tardigrade focuses on daily timeframe signals, predicting a more conservative outlook. His analysis identifies a recurring pattern where Dogecoin bounces off an ascending trendline, forming higher lows each time.

These price structures are often preceded by fake reversals ahead of the main breakouts. Specifically, in September of the previous year and April 2025, DOGE followed this bounce-and-breakout pattern. 

Image

Each event aligned with a rounded bottom in the RSI curve. Historically, such RSI patterns have led to strong rallies, especially when curving upward past the 50 mark. The analyst’s chart sets an intermediate target at $1, contingent on the current bullish setup holding.

Historical Pullback Behavior and Structural Consistency

In yet another chart update, Trader Tardigrade examined Dogecoin’s price action over a 3-day timeframe, identifying a consistent pattern of prior swing highs serving as future support.

In late 2023, DOGE broke past the $0.098 resistance, then tested and held that level as support in early 2024. A similar pattern occurred when a July 2024 swing high of $0.145 was revisited and confirmed as support in April 2025.

Furthermore, the February 2025 high of $0.29 marked another key reference point before the price corrected.

The return to the $0.145 support in April maintained the structural integrity seen in past cycles. Following this pullback, the next resistance has been projected above $0.23, with the potential to reach $0.80, a level that would surpass Dogecoin’s previous all-time high of $0.73.

Bitcoin May Be Worth an Infinite Amount of US Dollars: Venture Capitalist Tim Draper Explains Why

0

Tim Draper, an American venture capitalist, has strongly recommended exposure to Bitcoin, insisting its value will appreciate infinitely against the US dollar.

The staunch Bitcoin enthusiast is optimistic that the pioneering cryptocurrency would become a sovereign insurance policy, particularly amid the US dollar index capitulation. In a recent tweet, he predicted that Bitcoin will continually gain against the American dollar, citing a growing reallocation to the digital asset.

Uncertainties Unveil Bitcoin’s Admirable Qualities

Draper likened the Bitcoin against the US dollar situation to what happened during the 1861 Civil War. During the unrest, the Confederate States of America (CSA) issued a paper currency, which started off with a 1:1 peg with the US dollar.

However, the Confederate dollar decayed in value, trading at over 10 million against 1 USD at the war’s end. The venture capitalist suggested a similar incident would materialize with Bitcoin and the dollar as local and foreign investors lose credence in the powerhouse fiat currency.

Meanwhile, Draper cited the US dollar index crash as proof of this assertion. The financial instrument, which tracks the performance of the US dollar against six major foreign fiat currencies, has recorded its worst-ever start to the year, with an 8% correction YTD.

The index capsized amid escalating trade wars between the United States and several nations globally. Interestingly, the Bitcoin maximalist suggested that the metric may fall further if geopolitical tension persists.

Nonetheless, Bitcoin has stood its ground despite these uncertainties, drawing conclusions about the asset’s quality as a “safe haven.” Draper established that BTC has continued flourishing, with its unique attributes turning heads.

Gold Not in Bitcoin’s League: Draper

While many would naturally turn to gold during market uncertainties, Draper presented Bitcoin as a better alternative. He noted that Bitcoin is in a different league from gold and cited drawdowns that holding the precious metal could confer.

For context, the large-scale investor insisted that gold has transportation, storage, and utility constraints compared to Bitcoin. Notably, the asset’s digital nature and easy transactability are major lures in contrast to gold.

Meanwhile, Draper highlighted that governmental bodies are slowly turning to Bitcoin through strategic reserve proposals, reestablishing the asset’s growing prominence. According to him, Bitcoin has shown its outstanding qualities in the face of hyperinflation and would not desist from hedging against the financial menace.

It bears mentioning that Draper earlier predicted that Bitcoin would hit $250,000 under adoption by the United States and 30x to about $2.9 million per coin upon global traction.

Ethereum Eyes $2,000 as On-Chain Metrics Signal Bottom Formation

Ethereum is nearing a breakout above $1,850 as rising open interest, increasing long positions, and on-chain volume trends suggest a bottom may be forming.

As Bitcoin climbs above the $97,000 mark, Ethereum struggles around the $1,800 level. However, the daily chart reflects a short-term recovery trend, nearing a potential breakout rally. Will a post-retest reversal push Ethereum past the $2,000 mark?

Ethereum Price Analysis

In the daily chart, Ethereum’s price reversal has breached a long-standing resistance trendline, confirming a bullish breakout from a falling channel pattern.

Ethereum Price Chart

Ethereum is currently trading at $1,821 after a 2.51% surge last night. However, the bullish trend still faces strong resistance near the high-supply zone around the $1,850 level.

This resistance constrains the breakout rally and may lead to a potential retest. Still, the ongoing recovery has triggered a positive cycle in the MACD and signal lines.

The declining 50-day EMA aligns with the supply zone, acting as a dynamic resistance. A breakout above the 50-day EMA and the supply zone would likely generate a buy signal for price action traders.

Based on Fibonacci retracement levels, the next immediate resistance lies at the 23.60% level near the psychological $2,000 mark. Beyond that, the 200-day EMA near the 38.20% level at approximately $2,400 will serve as a critical resistance.

On the downside, key support remains near the $1,600 level.

Near-Zero Rates Fuel Surge in Long Positions

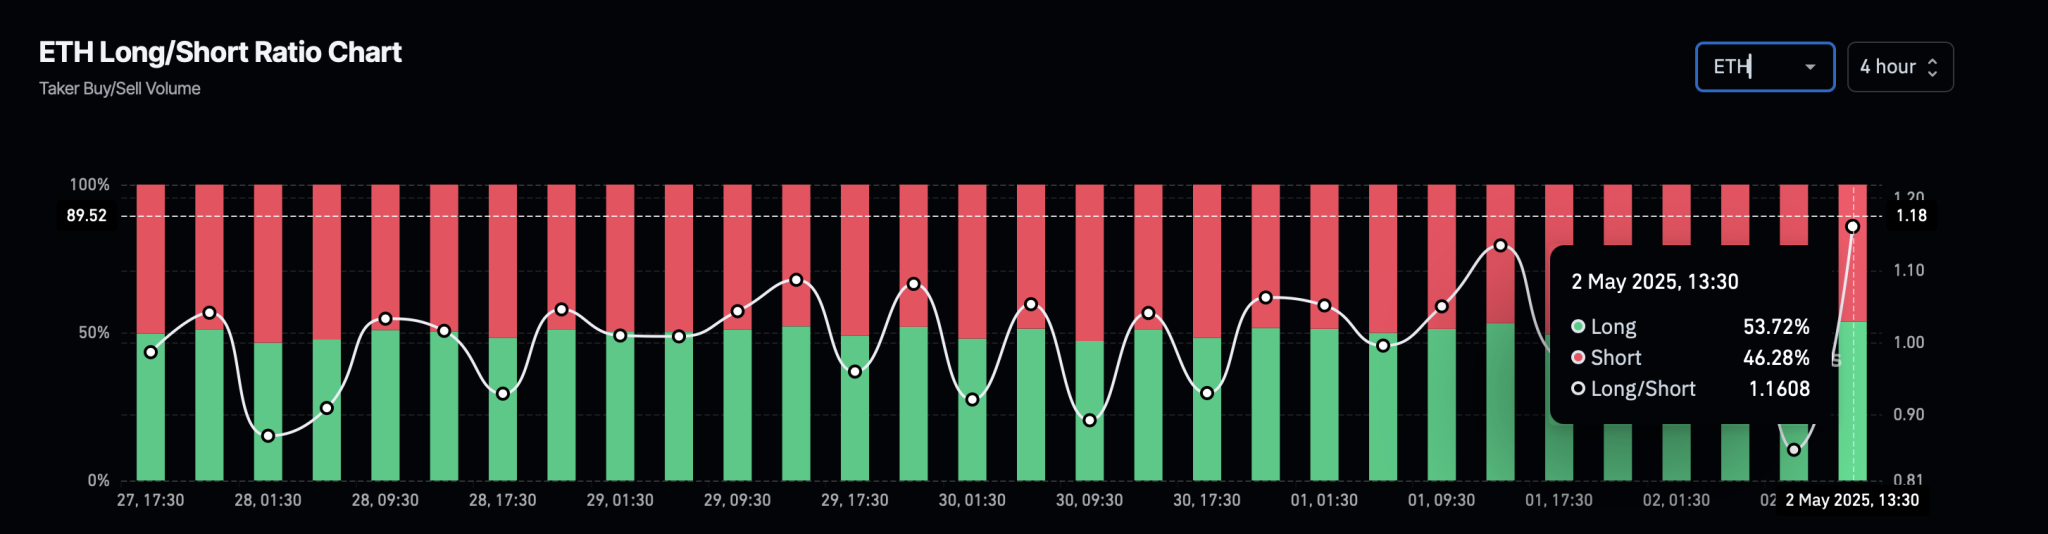
In the derivatives market, traders anticipate a major breakout rally in Ethereum. The Ethereum Long-to-Short Ratio chart shows 53.72% long positions accumulated over the past four hours.

ETH Long/Short Positions

This puts the Long-to-Short Ratio at 1.1608, indicating a bullish dominance. Additionally, open interest has increased by more than 3%, reaching $21.60 billion, while the overall market funding rate remains near 0%.

A near-zero funding rate lowers the cost of holding long positions, which is likely reinforcing bullish sentiment.

Historic Returns Suggest Bullish Reversal

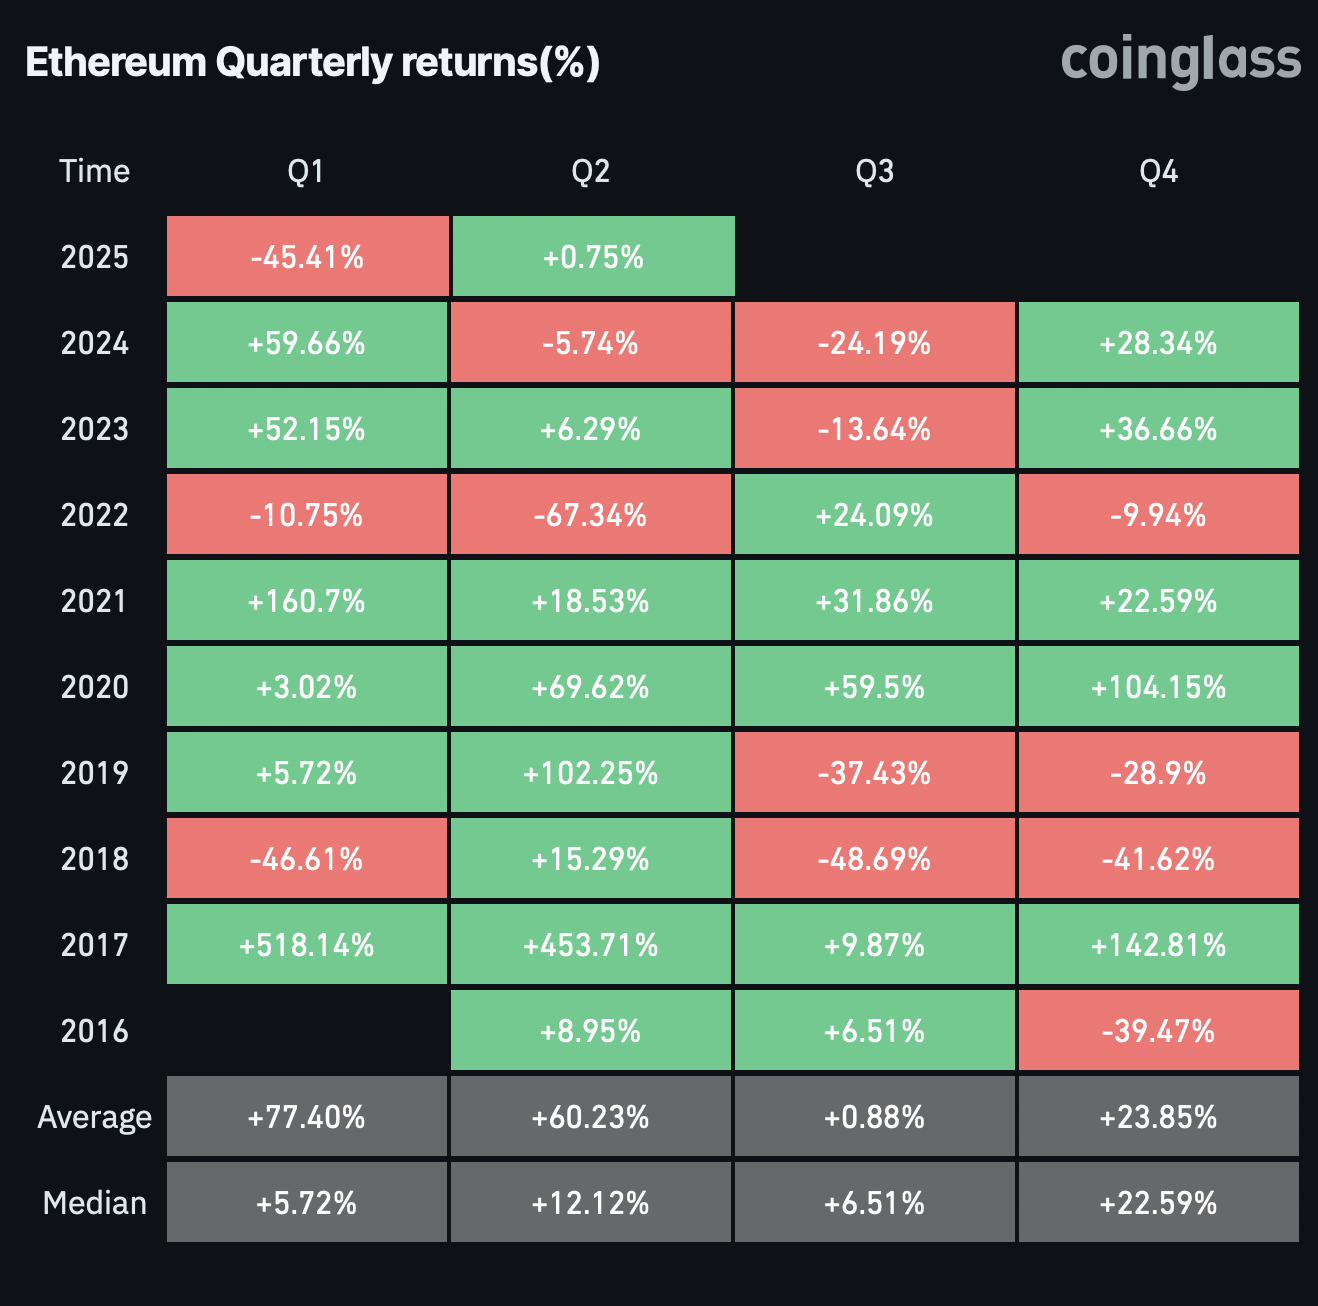
The historical price returns in Ethereum support the possibility of a breakout rally. Based on the data from CoinGlass, the Ethereum quarterly returns highlight a possibility of a bullish comeback. 

Since 2016, Ethereum has posted positive Q2 results in seven out of nine years—excluding 2022 and 2024. The average Q2 return stands at nearly 60%, with a median return of 12.12%.

Historic Quarterly Returns

Ethereum Selling Pressure Waning

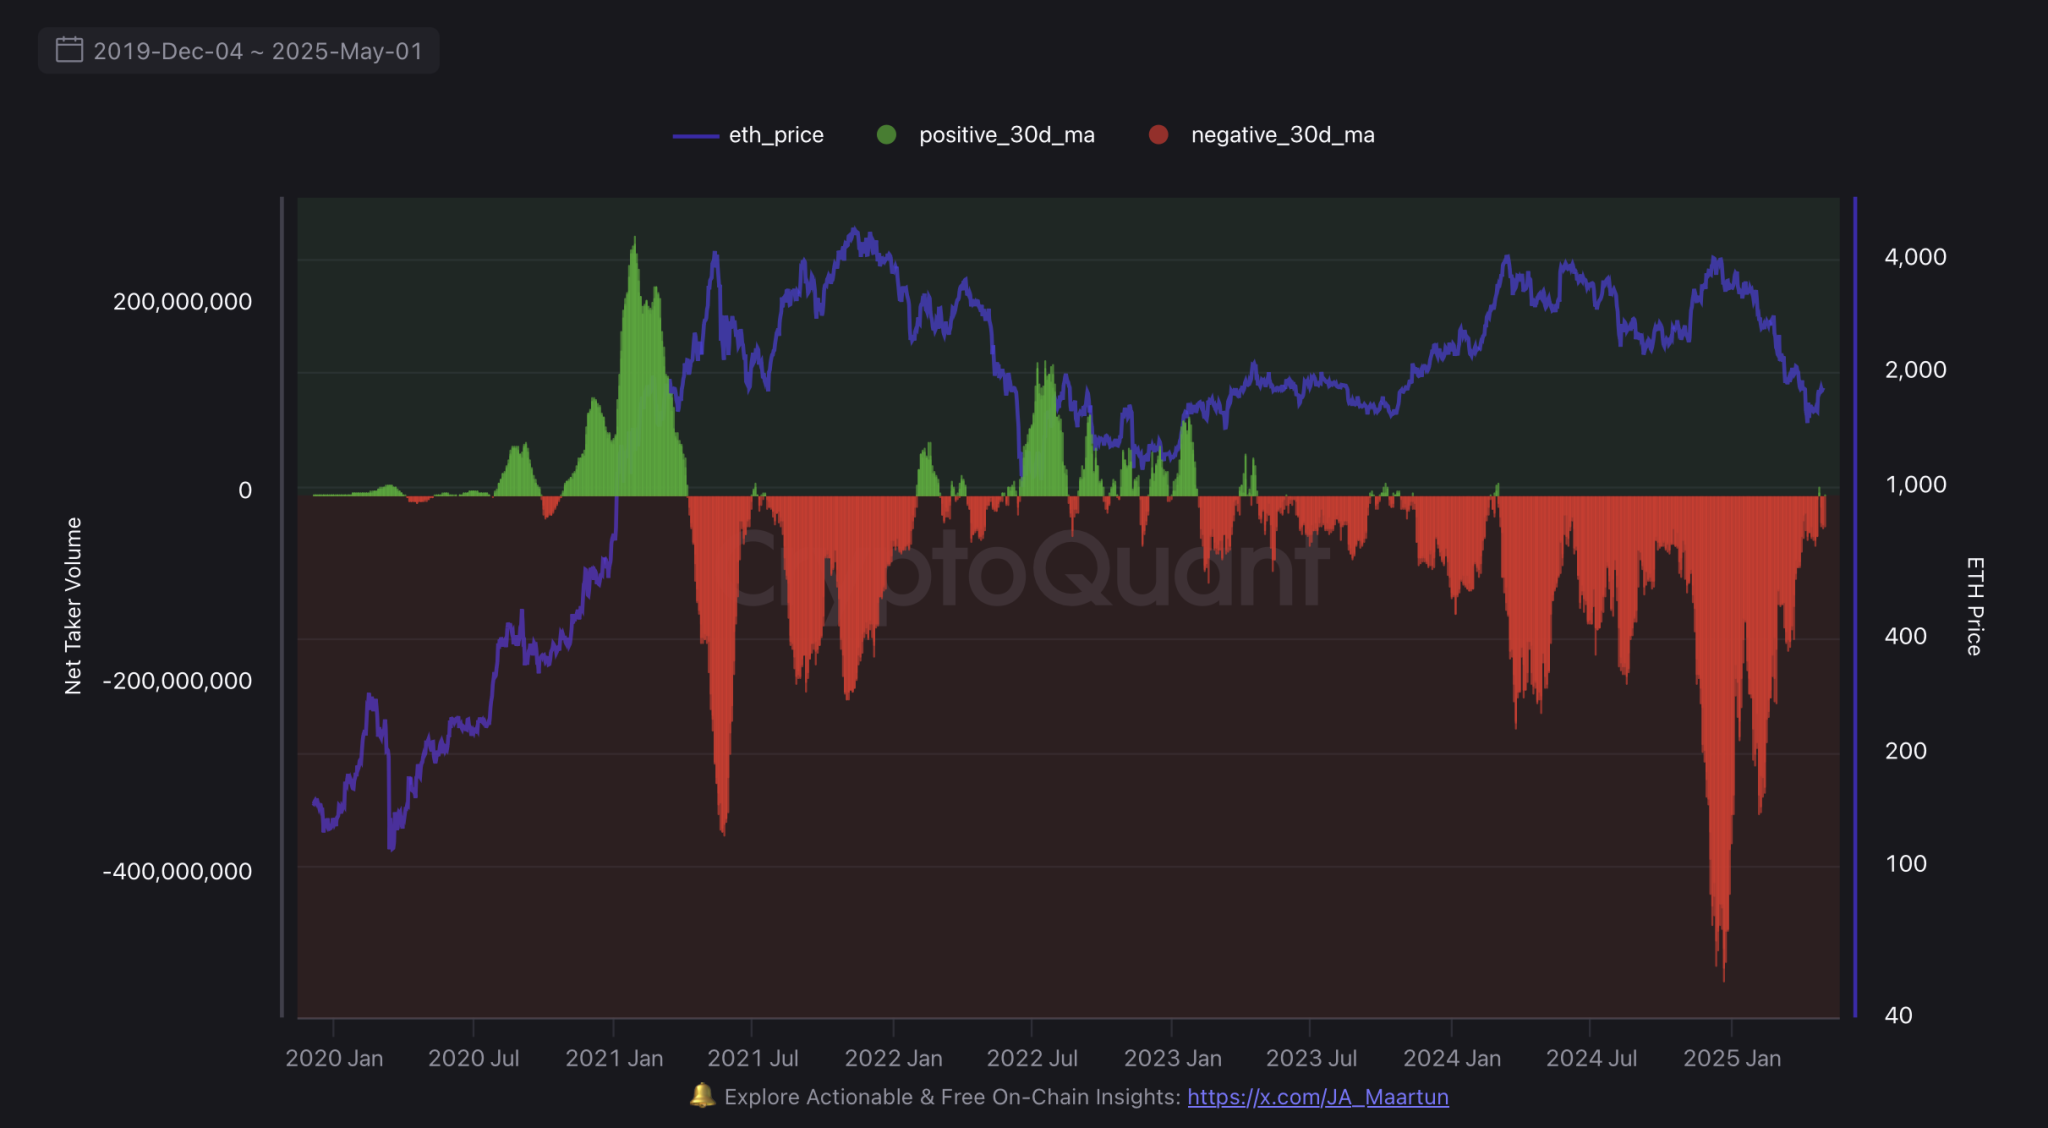
According to data from CryptoQuant, selling pressure in the derivatives market is gradually easing. The net taker volume turned positive on April 23 and 24 — a sign of growing buyer aggression.

As of May 1, the 30-day moving average stood at $311,406, reflecting a notable improvement. If this trend persists, Ethereum could be in the process of establishing a real bottom.

This shift may support a bullish recovery and increase the likelihood of a broader trend reversal in the coming weeks.

ETH Net Taker Volume

ETH Net Taker Volume

Media Personality Says XRP Not Dead, It’s Loading; Shares Why XRP Could Still Be the Biggest Sleeping Giant

Crypto media personality John Squire has boldly asserted that XRP is not dead despite recent lackluster price movements.

Instead, in his view, XRP “is loading,” potentially preparing for a historic rally. In a detailed thread, Squire outlined why he believes XRP may be the most undervalued and misunderstood asset in the market. According to him, 99% of investors are not ready for what’s coming.

First, he emphasized that, unlike newer, hype-driven tokens, XRP has spent the past ten years building a global payments infrastructure.

Squire claimed that Ripple Payments, which uses XRP, is active in over 55 countries and works with more than 350 financial institutions. Notable names include Japan’s SBI and Tranglo.

He stresses that this isn’t about “potential.” In his view, the foundation is already in place and the rails are live.

“Institutional Floodgates Opening Soon”

Squire also emphasized that XRP is the only top 10 crypto asset to have faced and survived a multi-year legal battle with the U.S. SEC. The lawsuit began in December 2020 and led to a partial legal victory in July 2023. Meanwhile, a final settlement announcement is due soon.

Squire believes that a full resolution could trigger “floodgates” of institutional adoption for XRP, potentially sending its price soaring. According to him, institutional interest is already warming up.

Institutional Money Is Warming Up

Specifically, Squire claimed that XRP’s alignment with traditional finance is growing stronger. He cited the Chicago Mercantile Exchange’s upcoming launch of XRP futures in May 2025. 

Notably, a similar product from Coinbase went live last month. CME’s entry into the space confirms institutional-grade interest in XRP.

Squire reinforced this point by referencing rumors of a potential XRP trust from BlackRock—arguably the most widely anticipated XRP ETF. He suggests that this isn’t retail-driven hype but early signs of Wall Street quietly positioning itself.

Tapping Into a $150 Trillion Market

While many crypto projects chase hype cycles, XRP targets the global cross-border payments market, worth over $150 trillion annually. Ripple projects that this market could grow to $300 trillion by the end of the decade.

The company’s payment rails are active in countries like Japan, Singapore, and the UAE. Squire emphasized that this level of adoption indicates a real-world use case already in motion.

He also speculated that major institutions like Bank of America, American Express, and Standard Chartered are not just watching from the sidelines but are already part of Ripple’s network.

“Price Action Is Boring on Purpose”

Despite widespread criticism, XRP continues to hold above $2. According to Squire, XRP’s underwhelming price performance may be intentional. He cited on-chain metrics showing rising volume and a cooling RSI. Squire argues that smart money moves quietly and buys when attention is elsewhere.

Hate as Fuel for the Next Rally

Accordingly, Squire suggested that hate could fuel the next rally. He stated that the widespread dismissal of XRP may be one of its strongest indicators.

The market pundit concluded that XRP is battle-tested, institutionally aligned, legally resilient, and globally deployed. According to him, XRP is showing all the hallmarks of a sleeping giant.

Essentially, in his view, while the market chases short-term narratives, XRP may be quietly loading in the background, waiting for its moment. And when it wakes up, as Squire puts it, “the whole game changes.”

Analyst Predicts XRP Price Rally Above $3, But First a Downward Move Below $2

0

XRP price began May with a retest of a key support level, but an analyst is eyeing this as a precursor of a bullish rally. 

Notably, XRP price is currently trading at $2.21, reacting to a recent rejection at the $2.25 resistance area. At press time, XRP price trading at $2.20, a 0.02% surge in the last day and a 4% increase over the past 30 days. 

Despite the rejection, a crypto analyst has forecasted a bullish outlook, noting that the rejection is prepping the XRP price for a breakout. 

XRP Short-Term Correction Hints at Bullish Breakout

According to crypto analyst CasiTrades, on the 4-hour chart, XRP has entered an Elliott Wave correction phase following a failed breakout above $2.25. After breaking above its long-term downtrend in early April, XRP formed a short impulse wave to around $2.27.

What followed was an ABC corrective wave structure that continues to unfold. The first leg, representing Wave A, triggered a downward move to $2.0157. After this, a minor rebound in the form of Wave B emerged, pushing XRP price to the $2.2743 zone. Meanwhile, current price movement suggests a developing C wave that may complete between $1.90 and $1.95.

According to CasiTrade, Fibonacci retracement levels are supporting this, with $1.9016 aligning with the 0.618 retracement level—a zone often associated with major support. RSI on the same timeframe has held above oversold levels and is forming a bullish divergence, where price made a lower low, but RSI did not. This is often an early indicator of weakening downward momentum.

However, this correction is happening within a larger uptrend buoyed in part by the XRP ETF odds of approval rising and Proshares XRP ETFs launch set for May 14. Moreover, XRP price has consistently formed higher lows and higher highs since breaking its previous downtrend in early April consistent with the early stages of a new bullish cycle. 

XRP Price Chart Shows Broader Bullish Reversal

Additionally, XRP’s structure continues to follow the Elliott Wave progression on the daily timeframe. A large five-wave upward movement that began around $0.30 reached its peak near $3.30 before transitioning into a broader correction. This correction unfolded in a WXY pattern, with the final low forming near the $1.44 to $1.54 range. 

These levels aligned with the 0.618 and 0.65 Fibonacci retracements, where buying pressure returned and price stabilized.

The reversal from the final low zone formed a bullish double bottom near $1.33, followed by a strong upward move that reclaimed the $2.00 area. The neckline of the double bottom was broken, and the price continued upward into the $2.25–$2.30 resistance band.

Holding above $1.90, which corresponds to the 0.5 retracement, supports the idea that the corrective wave has completed and that a new impulse wave may be starting. 

Moreover, the RSI on the daily chart stands at 54.61, confirming a healthy uptrend backing the bullish recovery to $3.

Meanwhile, another analyst, Egrag Crypto, has issued a more aggressive forecast, suggesting XRP could print a mega monthly candle, placing the target at $17 by the end of May.

Bitcoin Breaks Above $97K: Is $150K Possible in 2025?

Bitcoin tops $97,000 following a bullish flag breakout, as ETFs and firms like Strategy and MetaPlanet race to accumulate more BTC. Could this push Bitcoin to a new all-time high?

On May 1, Bitcoin surged by 2.44%, breaking above the $97,000 mark. After hitting a 24-hour high at $97,315, BTC currently trades at $96,637.

As the crypto market rebounds, Bitcoin now boasts a market cap of $1.91 trillion. Bullish momentum is accelerating, and growing institutional support and insights from veteran market analysts point toward a potential new all-time high.

Bitcoin Price Analysis

In the 4-hour chart, BTC exhibits consecutive breakouts from bullish flag patterns. The most recent breakout rally has created a swing high at $97,433. Bitcoin price chart

Bitcoin price chartBullish flags are considered trend continuation patterns, often extending ongoing rallies. Hence, the recent breakout run improves the upside potential in BTC prices.

The rally is currently consolidating just below the R1 pivot resistance at $97,981, reflecting the bulls’ struggle to surpass the $98,000 threshold.

Notably, the breakout has triggered a bullish crossover in the MACD and signal lines. Despite a minor pullback of 0.49% over the past two hours, Bitcoin may be preparing to retest the broken flag pattern before continuing upward.

Bitcoin could break past the R1 resistance if momentum continues post-retest, potentially clearing the path toward the $100,000 milestone.

Key resistance targets remain at the R2 and R3 pivot levels, near $102,200 and $108,600, respectively.

Veteran Market Analyst Targets $150K

Peter Brandt, a veteran market trader, has tweeted that Bitcoin could reach an all-time high of $125,000 or $150,000.

However, for the bullish trend to continue, the BTC price must overcome the recently broken parabolic support slope of $96,397, as per the chart shared. At present, Bitcoin trades at $96,600, reflecting that the largest crypto has resurfaced above the parabolic slope. 

Brandt suggests a timeframe for a new all-time high in August-September 2025. Meanwhile, the analyst highlights the possibility of a 50% plus correction in BTC prices post-market cycle top.

Metaplanet and Strategy Race to Grab More Bitcoin

Amid the market optimism, institutional interest in Bitcoin continues to surge, resembling a modern-day land grab.

Tokyo-based investment firm MetaPlanet recently announced the issuance of ¥3.6 billion in 0% ordinary bonds, intended to fund further Bitcoin purchases. These bonds are redeemable at face value upon maturity on October 31, 2025.

Meanwhile, U.S.-based Strategy, formerly known as MicroStrategy, has released its Q1 2025 earnings, alongside a new stock offering. As of April 28, the company holds 553,555 BTC.

With an average acquisition price of $68,459, Strategy’s total Bitcoin investment amounts to approximately $37.9 billion. The current market value of its holdings exceeds $52 billion.

Furthermore, Strategy has raised its 2025 “BTC Yield” target from 15% to 25%, increasing its projected “BTC $ Gain” from $10 billion to $15 billion.

Despite reporting a Q1 2025 loss of $4.21 billion, the company announced a $21 billion stock offering to purchase additional Bitcoin.

Bitcoin ETFs Mark Second Consecutive Month of Positive Net Inflows

Meanwhile, U.S.-listed spot Bitcoin ETFs saw $2.97 billion in net inflows during April 2025, following a $767.91 million outflow in March and a $3.56 billion inflow in February.

Since inception, spot BTC ETFs have recorded only four months of net outflows, reflecting overall bullish investor sentiment.

Bitcoin ETFs Monthly Netflow

The total net assets held by spot ETFs now stand at $111.99 billion, representing 5.85% of Bitcoin’s total market cap. On May 1, 2025, spot Bitcoin ETFs recorded a daily inflow of $422.45 million.

Conclusion

Bitcoin’s breakout above $97K signals strong bullish momentum. The rally is gaining traction with growing institutional investment and rising ETF inflows.

With price targets as high as $150K by late 2025, the long-term outlook remains optimistic, despite the possibility of short-term corrections.

SUI Eyes $5 With Range Breakout as Long Positions Surge to 60%

SUI is consolidating near $3.46 with strong bullish indicators. Will the dominance of long positions lead to a breakout rally toward $5.14?

As Bitcoin holds its ground above the $96,000 mark, altcoins are gaining momentum. With bulls taking control, the total crypto market has reached a capitalization of $3 trillion.

Among the top performers in the growing altcoin market, SUI has emerged as a standout. Currently trading at $3.46, SUI has a market capitalization of $11.61 billion.

Now ranked as the 11th-largest cryptocurrency, SUI recorded a 54% increase in April. Could this strong uptrend push SUI to a new all-time high?

SUI Price Analysis

On the 4-hour price chart, the SUI token is displaying a consolidation range between $3.41 and $3.83. Currently positioned at the lower boundary, SUI is showing signs of a potential bounce.

SUI Price Chart
SUI Price Chart

According to trend-based Fibonacci levels, the range boundaries align with the 0% and 23.60% levels. With a 1.42% surge in the past four hours, SUI is demonstrating bullish strength at the lower range, increasing the likelihood of a reversal.

The stochastic indicator shows a bullish crossover, and the MACD and signal lines are also approaching a crossover. This would signal a trend reversal and increase the probability of SUI retesting the upper boundary.

If SUI breaks out of the consolidation, the uptrend could target the 50% Fibonacci level at $4.28, followed by the ultimate price target of $5.14. On the downside, key support remains near the psychological level of $3.00.

Long Positions in SUI Nears 60%

As SUI holds within its consolidation range, the potential for a bullish breakout has driven an increase in long positions in the derivatives market. According to data from CoinGlass, the SUI long-to-short ratio has risen to 1.4734.

SUI Positions

This indicates that 59.57% of positions in the past four hours have been long. With leveraged long positions increasing, SUI may be poised for a price surge.

Notably, SUI’s open interest has climbed by more than 6%, reaching $1.55 billion, while the funding rate has risen to 0.0159%. The elevated funding rate underscores strong bullish sentiment, suggesting a potential for an extended rally.

Analyst Says Be Careful With Cardano as Bull Flag Breakout Could Trigger Major Rally to $1.30

0

Analyst CobraVanguard identifies a bullish flag on Cardano’s 3-day chart, but traders must wait for a breakout confirmation.

Cardano (ADA) maintained a narrow trading range between $0.67 and $0.72 over the past week, reflecting short-term volatility. Although the token recorded a 2.3% gain in the last 24 hours, it dropped slightly by over 1% in the past 7 days. 

However, behind the tight price action, technical indicators and derivatives market data suggest a critical phase in ADA’s consolidation.

Bullish Chart Patterns Signal Potential Upside

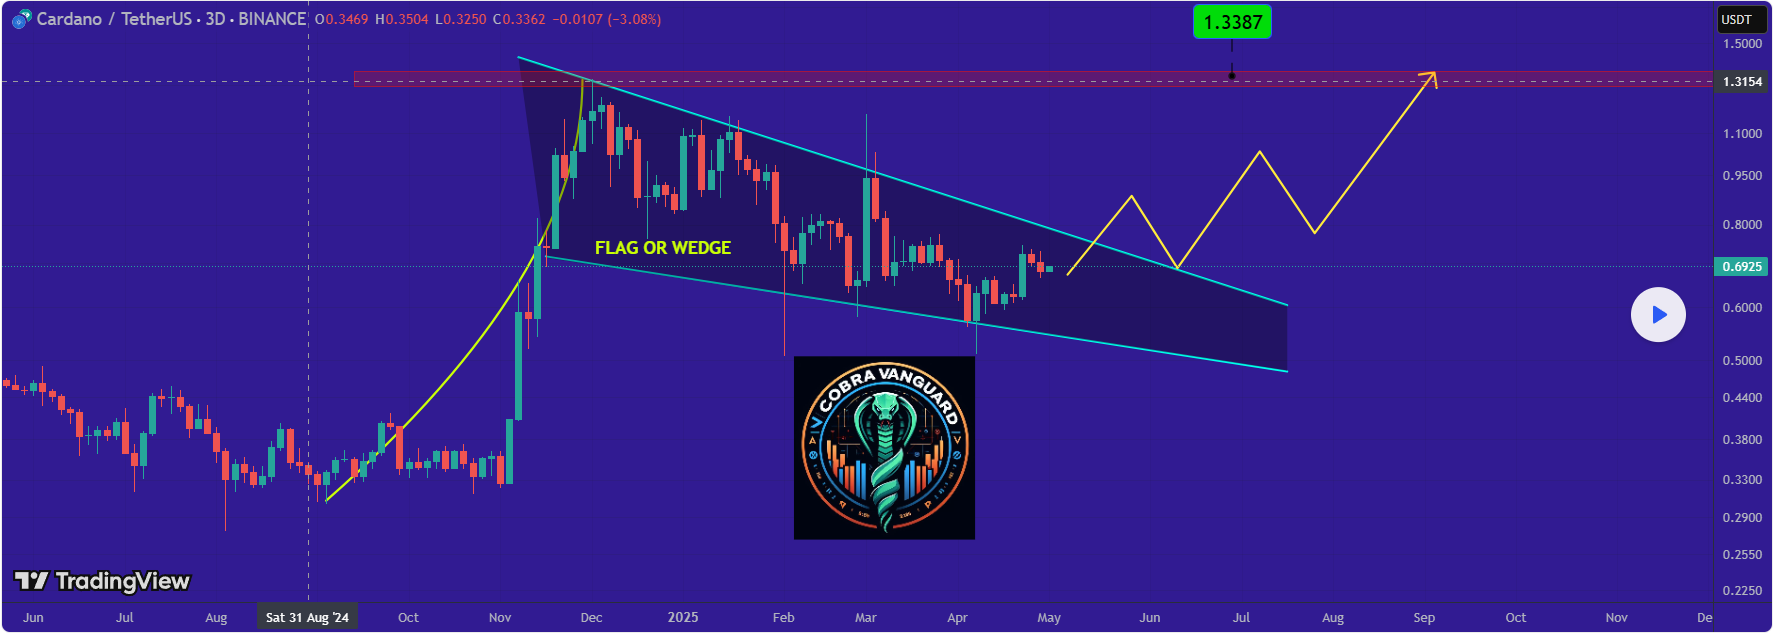
On TradingView, analyst CobraVanguard identified a bullish continuation pattern on the 3-day ADA/USDT chart. The structure resembles a falling wedge or flag formation. 

Cardano Price Prediction

This setup follows a steep rally from early November 2024 to early December 2024, when ADA surged from around $0.30 to a peak above $1.30. This movement formed the “flagpole” of the pattern, which has since transitioned into a downward-sloping channel.

The wedge began forming in early January 2025 and continues through May 2025. Prices have oscillated within the upper resistance and lower support trendlines, failing to break either decisively. Resistance held firm at $1.30, $1.10, and $0.90, while support levels at $0.63, $0.60, and $0.56 kept the bears in check. 

CobraVanguard emphasized the importance of waiting for a breakout above the flag’s upper trendline. If that occurs, ADA may aim for $1.3387, a potential 89.18% rally from its current price of $0.7076.

Key Demand and Resistance Zones

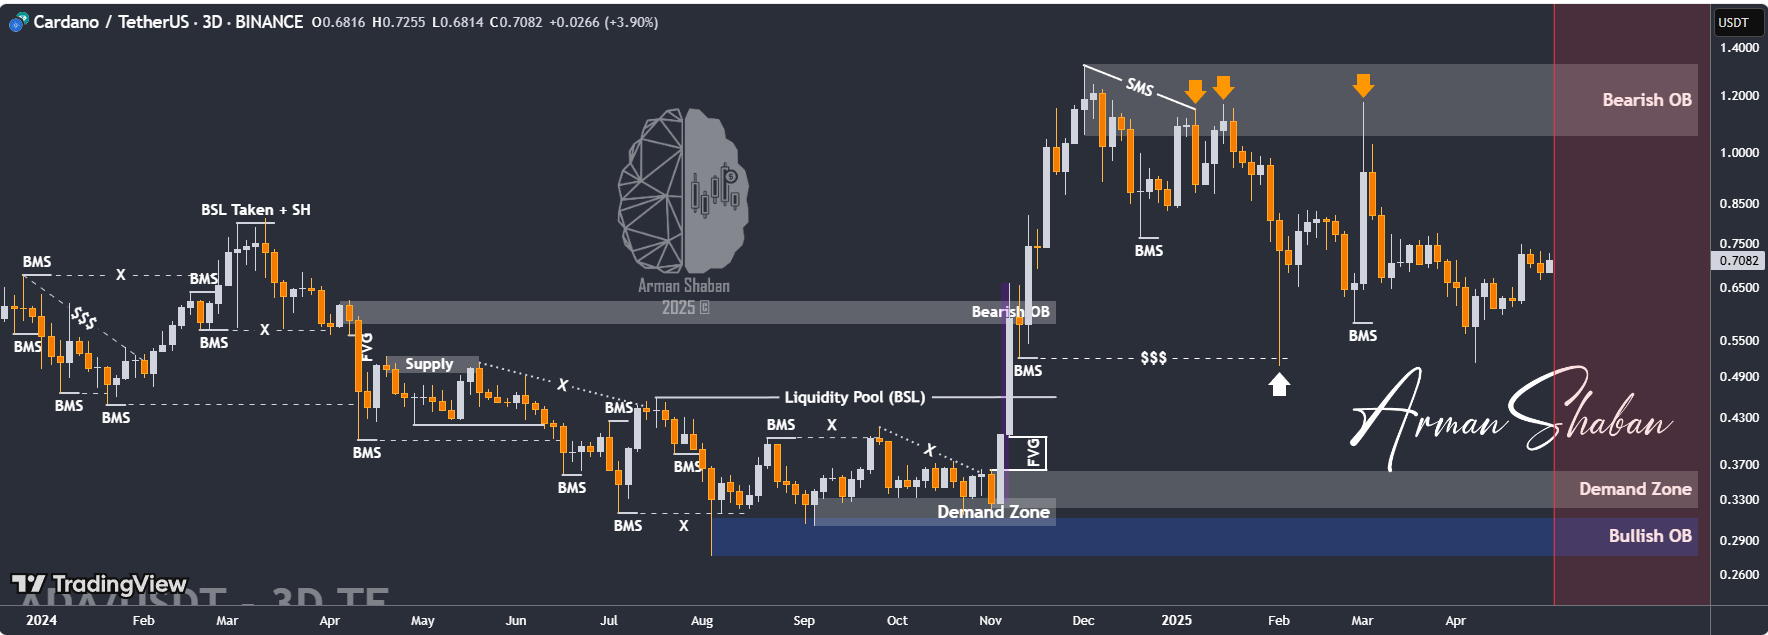
A second analysis by Arman Shaban, also on TradingView, added context using Smart Money Concepts. His 3-day ADA/USDT chart mapped a full market structure cycle. ADA rose sharply from $0.33 to nearly $1.32 before reversing near a Bearish Order Block. This area, located in the upper grey zone, introduced strong sell pressure that initiated a corrective phase.

Cardano 3-day Chart
Cardano 3-day Chart

During the retracement, the price declined to a Demand Zone around $0.50. This zone aligned with a Bullish Order Block. The price was then rebalanced by filling a nearby Fair Value Gap, which provided a key entry point. 

ADA currently trades around $0.7082, consolidating just above the critical $0.65 support zone. According to Shaban’s observation, upcoming resistance and potential target zones are $0.75, $0.81, $0.93, and $1.05.

Growing Long-Side Confidence

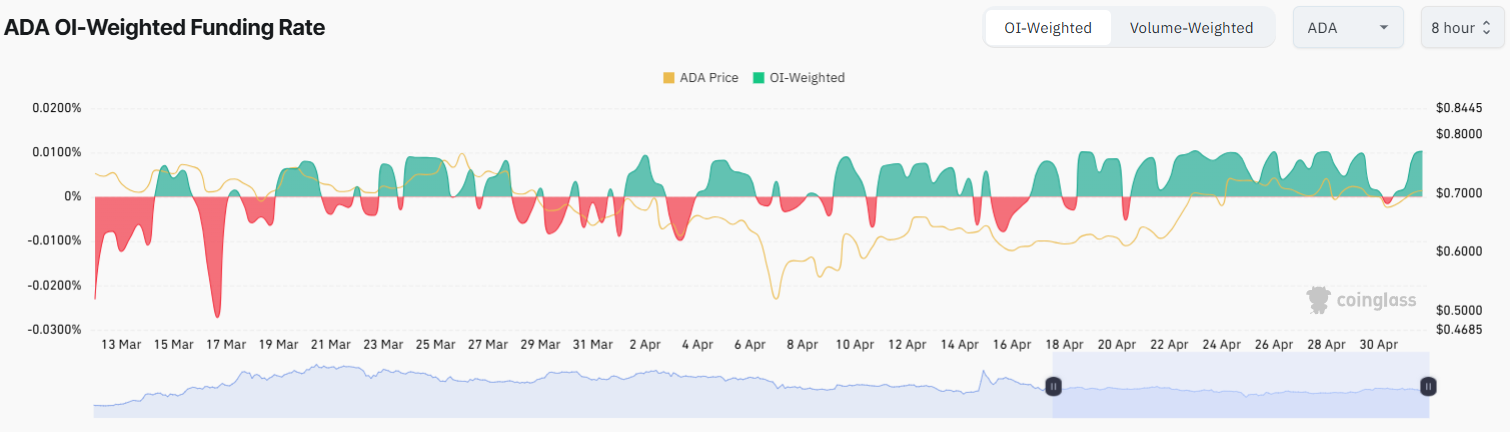
Beyond price charts, sentiment from the futures market supports the bullish outlook. According to Coinglass data, the ADA OI-Weighted Funding Rate chart reveals consistent positive funding since mid-April. This means long-position holders have been paying shorts, showing that more traders are betting on price increases.

Cardano Derivatives Data

Notably, this trend aligns with ADA’s gradual climb from below $0.61 to over $0.70. The synchronized rise in funding rates and price points is due to strong participation from both spot and derivatives markets. Notably, this data supports the bullish outlook presented in recent technical analyses.