Home Blog Page 77

History Signals Mixed July Outlook for Shiba Inu After Brutal 24% Decline in June

0

As July begins, Shiba Inu investors are closely monitoring the market for signs of recovery after the token endured a brutal June.

The month of June marked SHIB’s most bearish period of 2026 and left market participants uncertain about the weeks ahead. For context, Shiba Inu plunged 24% in June 2026, making it the second-worst June in the asset’s history. Only June 2024 delivered steeper losses, with SHIB closing the month down 32%.

The sharp sell-off significantly impacted Shiba Inu’s market standing. During the downturn, SHIB dropped out of the top 30 cryptocurrencies by market cap and slid to a five-year low below $0.0000041.

Moreover, heightened volatility wiped out hundreds of thousands of dollars in leveraged SHIB positions across multiple trading sessions. Although the token recovered enough to reclaim its place among the top 30 before June ended, uncertainty continues to weigh heavily on investor sentiment.

Historical July Performance Delivers Mixed Signals

Historically, July has produced inconsistent results for Shiba Inu. SHIB fell 28.5% in July 2021 before rebounding with gains of 13.4% in July 2022 and 11.8% in July 2023. However, bearish pressure returned in July 2024, pushing the token down 7.74%.

The asset bounced back the following year and recorded an 8.92% increase in July 2025, highlighting the unpredictable nature of SHIB’s seasonal performance. So far, July 2026 has opened on a positive note, with Shiba Inu posting a modest gain of 0.77% on the first day of the month.

According to CryptoRank’s monthly returns data, Shiba Inu has delivered an average July return of -0.18%, while the median return stands at 4.85%.

Nevertheless, these historical figures do not guarantee either a rally or another decline this month. In recent months, SHIB has largely mirrored the broader cryptocurrency market, which continues to trade under bearish pressure. 

Shiba Inu Monthly Returns

SHIB Reclaims Top 30 Status as Prices Recover

At press time, SHIB trades at $0.000004210, reflecting a 22.13% decline over the past 30 days. Notably, trading activity has shown modest improvement, with daily volume increasing 2.55% to $62.87 million.

Furthermore, SHIB’s rebound above the $0.0000042 level, coupled with the decline in Tether Gold’s market ranking, helped the token return to the list of the world’s top 30 cryptocurrencies by market capitalization.

Shiba Inu now ranks as the 29th-largest cryptocurrency with a market valuation of $2.48 billion. 

On-Chain Metrics Remain Bullish Despite Weak Burn Activity

Despite recent price weakness, several on-chain indicators continue to signal growing investor confidence.

Most notably, investors withdrew more than 128 billion SHIB tokens from exchanges, reducing exchange reserves from above 87 trillion tokens to 86.97 trillion. Typically, declining exchange balances suggest that holders are moving assets into private wallets for long-term storage rather than preparing to sell. 

Shiba Inu Exchange Flows

In contrast, SHIB’s burn activity remains subdued. Over the past 24 hours, the community removed only about 4 million tokens from circulation, underscoring the ongoing slowdown in token burn efforts.

Consequently, investors will closely watch whether improving sentiment, stronger burn activity, and declining exchange reserves can fuel a broader recovery for Shiba Inu throughout July. 
XRP Aims Higher as New Wallet Creation Spikes to 14-Week High

0

XRP is seeing a boost in on-chain activity despite its price underperformance, fueling speculations of an imminent price move.

June marked the biggest monthly correction for XRP since February 2025. The token declined by 22% last month, continuing its retest of lower prices after hitting a peak of $3.66 in July 2025. Nonetheless, while prices remain weak, recent on-chain activity is feeding the optimism that things might temporarily change for the good.

New XRP Wallets Spike

Santiment data shows that new wallet creations on the XRP Ledger recently spiked. In a single day, 4,941 new addresses were added to the network, the highest level of adoption and user traction in 14 weeks.

Accompanying this is the surge in bullish sentiment. Per Santiment, there were 3.7 bullish XRP comments per 1 bearish XRP comment on social media. Interestingly, the ratio of XRP positive to negative comments is at a 3-month high, with market participants viewing the current dip as a buying opportunity.

XRP New Wallet Spike/Santiment

The combination of rising new wallet creation and bullish sentiment suggests dip buying. The current level near the $1 support appears compelling because of its favorable risk-to-reward, so users appear to be loading up the asset.

Also, a surge in daily active XRP addresses further confirms this renewed momentum on the XRP Ledger. Recent data shows a 36% increase in the number of addresses active on the Ledger per day, reinforcing network growth. While some analysts claim it could be whales selling, on-chain data continues to reveal that it might be a dip-buying attempt.

XRP Clings to $1 Despite Strong ETF Inflows

Another positive for XRP is the persistent inflows from the US XRP spot ETFs. The Bitcoin and Ethereum spot ETFs have struggled lately, but capital seems to be rotating into the XRP funds, reflected in their outperformance.

Although the XRP ETFs recorded an outflow of $2.83 million on June 30, it was only their second net daily outflow of the month. Institutional traction remained consistent for the investment vehicles in June, resulting in a net inflow of $59.5 million. BTC and Ether ETFs recorded net outflows of $4.51 billion and $529 million during the same period.

However, the XRP price continues to trade near the $1 support, with very little upward momentum. Analysts are now closely observing if these bullish factors will start to reflect in the asset’s price action.

From a technical perspective, XRP trades below the 20-day EMA at $1.10 and the 50-day EMA near $1.20. These two levels are the critical resistance to watch should the price start to move on the network growth and ETFs demand catalysts. Reclaiming these levels opens the path to reaching the 100-day and 200-day EMAs at $1.30 and $1.51.

XRP 1D Chart Analysis

Downward risks remain despite the optimistic developments. Losing the $1 support, if bears continue to control prices, could see XRP reach lower prices. The $0.80 and $0.62 supports come into focus in this event.

XRP Faces Make-or-Break Moment as Bullish Signals Clash With Whale Selling

XRP is approaching a critical turning point as technical indicators and on-chain data send mixed signals. 

Several chart patterns suggest a short-term rebound may be forming. However, continued whale selling and a key support test indicate volatility could remain high in the days ahead.

Technical Indicators Suggest a Short-Term Rebound

XRP has flashed two bullish signals on the daily chart. The first is the Tom DeMark Sequential buy signal, which has printed a “9” candlestick. Historically, this pattern has preceded one to four days of relief rallies after extended selling pressure.

XRP has also formed a Morning Star Doji pattern over the past three daily sessions. This candlestick formation is a sign that bearish momentum is fading and a local bottom may be developing.

If buying volume strengthens, XRP could rebound toward $1.27. A move to around $1.35 is also possible.

Rising Network Activity Supports the Bullish Case

On-chain data from Santiment also points to improving network activity. Daily active XRP addresses have increased sharply over the past two weeks. The number rose from about 23,000 on June 14 to nearly 40,000 by June 28. That represents an increase of roughly 50%.

Notably, the rise suggests more users are interacting with the XRP Ledger. Higher address activity is a sign of improving network health and can sometimes precede stronger trading interest.

Whale Selling Remains a Headwind

Despite the increase in network activity, large XRP holders continue to reduce their positions. Santiment reported on June 19 that whales sold more than 30 million XRP over a five-day period. 

The firm suggested the recent rise in active addresses may partly reflect whales moving tokens to exchanges rather than broad retail participation. If whale selling continues, it could offset the bullish technical signals and keep pressure on the price.

$1.06 Becomes the Key Level to Watch

On-chain data from Glassnode identifies $1.06 as XRP’s most important support level. According to the firm’s UTXO Realized Price Distribution (URPD) data, more than 830 million XRP previously changed hands at this price. That makes it a significant area where buyers may try to defend the market.

If XRP stays above $1.06, the recent buy signals could gain confirmation. That could open the door to a move toward $1.27 and possibly $1.35.

However, a daily close below $1.06 could trigger a deeper correction. The next major support levels are around $0.80, $0.62, and $0.51, where large amounts of XRP were previously traded.

BITSTAMP:XRPUSD Chart

Channel Resistance Keeps Bears in Play

The broader technical picture remains cautious. XRP recently hit resistance at the upper boundary of its trading channel. It has since started moving back toward the middle of the channel.

That area overlaps with the $0.70-$0.80 support zone, making it another important level if $1.06 fails to hold.

CSWAP Announces New Integration That Simplifies Bitcoin Access to Cardano Ecosystem

0

CSWAP has highlighted a new integration aimed at simplifying how Bitcoin holders can participate in decentralized finance on the Cardano network.

The update follows an announcement from BTC Karma, CSWAP’s Bitcoin-native DeFi protocol, confirming support for the Phantom Wallet. With the integration now live, Bitcoin users can connect their Phantom wallets directly to BTC Karma and stake BTC in just a few clicks.

According to BTC Karma, the new wallet support removes onboarding friction and creates a more straightforward path for Bitcoin holders seeking yield opportunities through decentralized finance applications.

CSWAP Positions Wallet Expansion as a Liquidity Gateway

Following the announcement, CSWAP emphasized the broader importance of the integration for the Cardano ecosystem. 

The protocol noted that every additional wallet it supports lowers the barriers that prevent Bitcoin liquidity from flowing into Cardano-based applications. Consequently, the addition of Phantom support marks another step toward attracting the next generation of Bitcoin DeFi users. 

“Every wallet we support makes it easier for Bitcoin liquidity to enter the Cardano ecosystem,” CSWAP remarked. 

CSWAP CEO Hints at More Integrations

Reacting to the launch, CSWAP founder and CEO Jon Kravetz reiterated the team’s commitment to expanding BTC Karma’s reach across additional wallets and user communities.

He described the Phantom integration as part of a broader effort to extend the BTC Karma ecosystem across the cryptocurrency industry. Furthermore, Kravetz hinted that the team is already developing additional integrations, signaling plans to continue lowering entry barriers for Bitcoin holders interested in Cardano’s DeFi opportunities. 

For context, BTC Karma is widely regarded as the first Bitcoin-native DeFi protocol operating directly on the Cardano mainnet. The platform serves as a bridge, allowing Bitcoin holders to earn yield and receive new tokens while participating in the Cardano ecosystem.

Notably, the protocol’s design aligns closely with Cardano founder Charles Hoskinson’s vision of bringing idle Bitcoin capital into the ADA ecosystem. Hoskinson argued that Cardano can unlock more than $2 trillion in Bitcoin DeFi opportunities, stressing that the network has a strong chance of becoming a major player in the emerging sector.

Cardano Continues to Expand Its Bitcoin DeFi Ambitions

Meanwhile, Cardano continues to advance its broader DeFi strategy through several processes, including Bitcoin integration initiatives.

Earlier this year, Fluid Tokens completed the first atomic swap between Bitcoin and Cardano, demonstrating growing interoperability between the two networks. In addition, Cardano previously introduced its first Bitcoin DeFi protocol, Cardinal, which allows BTC holders to bridge and stake their assets without selling them.

Hoskinson also revealed plans earlier this year to launch a one-click Bitcoin yield system on Cardano before year-end. However, the project has yet to provide an update on its progress.

In the meantime, competition in the Bitcoin DeFi sector continues to intensify, with rivals such as Flare arguing that they are better positioned to lead the race for Bitcoin-based decentralized finance. 

Daily New XRP Addresses Top 6,000 for the First Time in Three Months

The XRP Ledger has recorded more than 6,000 newly activated addresses in a single day for the first time in over three months, as network activity returns.

This development comes even as broad market selling pressure continues to weigh on XRP’s price, pushing it to new yearly lows. After climbing back to $1.29 in mid-June, XRP followed the wider market downturn, eventually falling to a new yearly low of $1.00795 by June 26.

XRP Sees 3-Month Peak in New Daily Addresses

Interestingly, while the price continues to struggle near the lower end of the key $1 psychological level, currently trading around $1.04, activity on the network appears to be gaining momentum again. 

Data from XRPScan, a leading XRP Ledger (XRPL) block explorer, shows that the network recorded exactly 6,221 new addresses on June 30. 

Daily New XRP Addresses

For context, this figure represents a new three-month high in daily XRP address creation, suggesting that on-chain adoption may be starting to recover.

The last time the XRP Ledger recorded more than 6,000 new addresses in a single day was on March 19, when it added 8,817 wallets, which remains the second-highest daily total so far this year.

Building on a Growing Trend

What stands out is that the recent surge above 6,000 addresses appears to be part of a broader upward trend in network activity and adoption, following several weeks of relatively subdued growth.

After reaching the 8,817 peak on March 19, the XRP Ledger went on to record an average of about 2,400 new wallets per day from March through late June. 

During this period, the highest single-day total was 4,131 addresses on May 20, which appears to have been a short-lived spike rather than the start of a sustained increase.

However, beginning on June 24, daily address creation started to pick up again, showing consistent growth that led to the latest surge above 6,000. Specifically, the network added 3,185 new addresses on June 24, followed by 3,720 on June 25, and then 3,761 on June 26.

Although there was a slight pullback to 3,287 on June 27, the upward momentum returned, with new addresses rising to 3,803 on June 28 and then reaching a three-month high of 4,575 on June 29. This gradual build-up ultimately led to the jump to 6,221 addresses recorded yesterday 

Total XRPL Addresses Approaching 8M

Amid this renewed activity, data from XRPScan shows that the total number of activated wallets on the XRP Ledger is now approaching the 8 million milestone, currently standing at 7.968 million at the time of writing.

Total Activated XRP Addresses XRPScan

At the start of June 2026, this figure was 7.893 million, which confirms that the network added nearly 74,500 new wallets over the course of the month. This was an improvement compared to the roughly 69,000 wallets added in May 2026.

Overall, the total number of activated XRPL addresses has increased from 7,466,236 at the beginning of the year to 7,968,015 at present, showing that the network has added more than 501,000 new addresses in the first half of the year, with an average monthly increase of about 83,629 wallets.

RLUSD Growth Is Boosting XRP Activity, Not Replacing It, Evernorth’s On-Chain Data Shows

A new report from Evernorth says the rapid growth of Ripple USD (RLUSD) on the XRP Ledger has strengthened the network instead of competing with XRP.

According to the company, concerns that RLUSD could reduce XRP’s role are not supported by on-chain data. Every RLUSD trade settles on the XRP Ledger, generating XRP transaction fees, increasing liquidity, and adding to network activity.

RLUSD Trading Share Reaches 12%

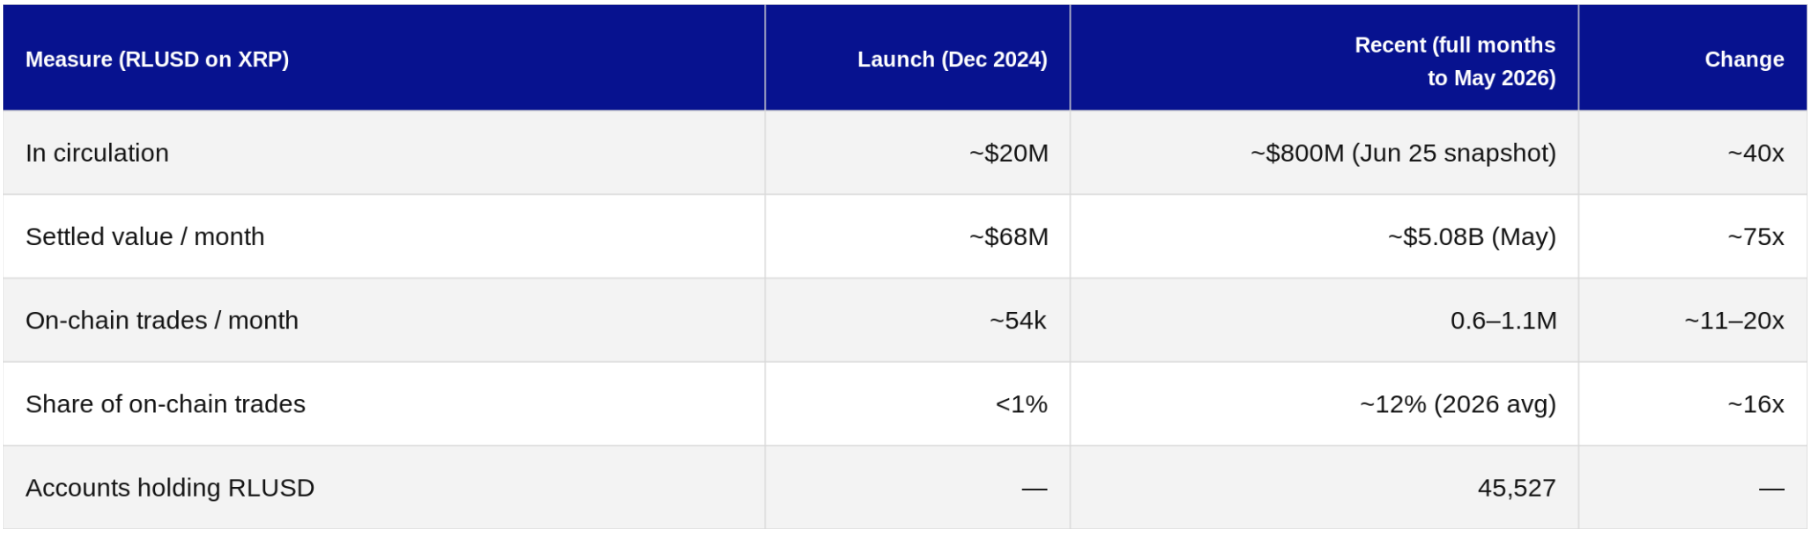
According to Evernorth, RLUSD’s share of on-chain trading on the XRP Ledger has grown from less than 1% to around 12% in under 18 months.

The report said the RLUSD/XRP trading pair processed about $900 million in trading volume over the past six months. That created a deep dollar-denominated market that did not exist on the network around 18 months ago.

Overall, more than $2.5 billion has been traded through RLUSD pairs on the XRP Ledger since the stablecoin launched.

Although overall DEX trading on the XRP Ledger declined during the same period, Evernorth said RLUSD captured a larger share of activity. The company said this suggests users are increasingly trading with a dollar-based asset while still relying on XRP as the settlement layer.

Every RLUSD Trade Still Uses XRP

Evernorth said RLUSD and XRP serve different roles within the ecosystem.

The report describes RLUSD as the dollar-denominated asset, while XRP remains the neutral bridge asset that most trading routes through.

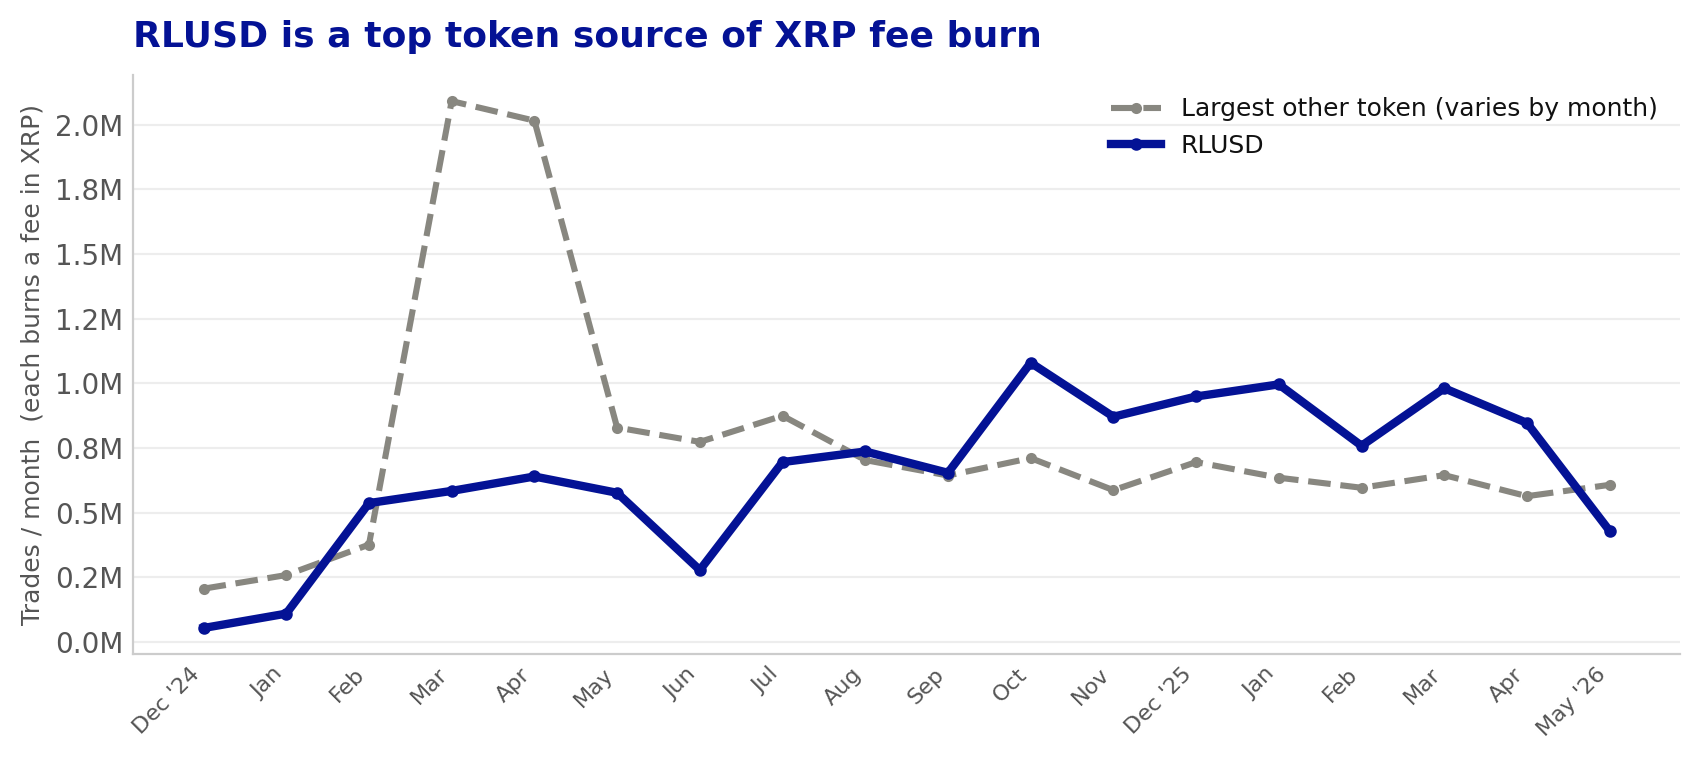
Because every RLUSD trade settles on-chain, each transaction pays fees in XRP. Evernorth estimates RLUSD trading now generates about one million XRP Ledger transactions every month. Each transaction also contributes to XRP fee burns.

The report argues that a larger RLUSD market leads to more XRP activity, deeper liquidity, and continued XRP fee generation rather than replacing XRP.

Similar to Traditional Foreign Exchange Markets

To explain the relationship, Evernorth compared RLUSD’s role on the XRP Ledger with the U.S. dollar’s position in traditional foreign exchange markets.

The report noted that the U.S. dollar appears on one side of about 88% of global foreign exchange trades, making it the world’s dominant trading currency.

According to Evernorth, RLUSD/XRP is developing a similar structure on the XRP Ledger. RLUSD is becoming the network’s primary dollar trading pair, while XRP continues serving as the settlement asset behind those trades.

Most RLUSD Supply Now Resides on XRP

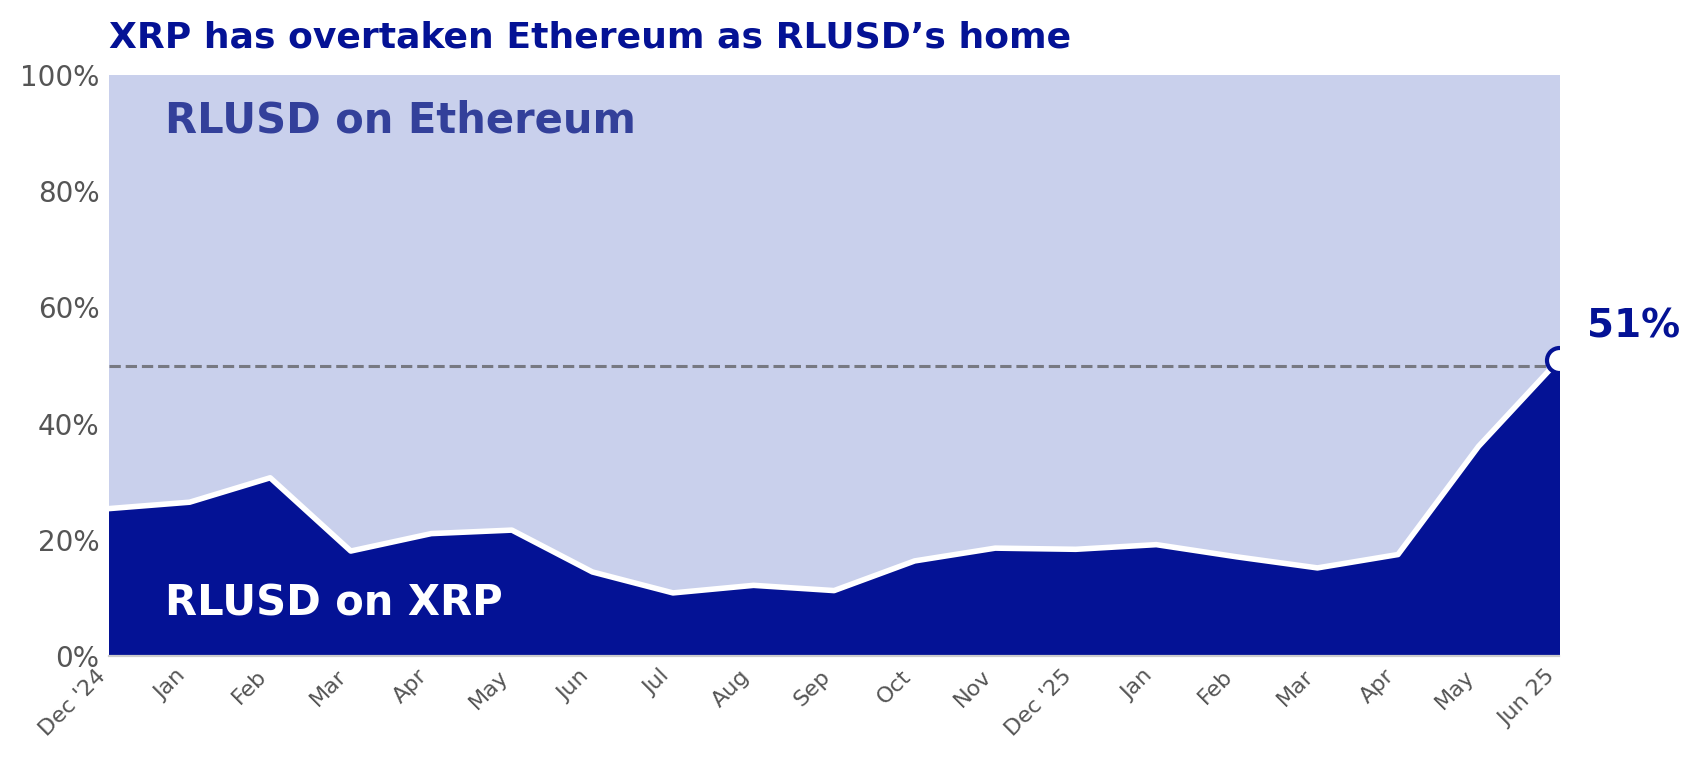
The report also highlighted RLUSD’s rapid shift toward the XRP Ledger. RLUSD circulating on XRP increased from about $20 million at the end of 2024 to over $800 million by late June 2026. That represents about a 40-fold increase.

Evernorth said the XRP Ledger has now overtaken Ethereum as the leading network for RLUSD. About 51% of all RLUSD in circulation now resides on XRP, up from around 17% in April 2026.

The report added that RLUSD is held by 45,527 XRP Ledger accounts. It also said 93,898 trust lines have been established, indicating growing wallet adoption and readiness for the stablecoin.

Meanwhile, the value of RLUSD settled through direct payments on the XRP Ledger rose from about $68 million in December 2024 to approximately $5.08 billion in May 2026. Evernorth said the increase points to growing institutional and large-value transfers alongside rising trading activity.

Cardano Stablecoin Market Surges 14.67% as Valuation Climbs Above $60M

0

The stablecoin market on the Cardano network recorded a double-digit increase over the past week, pushing its valuation above the $60 million mark.

According to data from DeFiLlama, Cardano’s stablecoin market cap climbed to $60.39 million, representing a 14.67% increase over the past seven days. The rise marks one of the strongest short-term expansions in the network’s stablecoin sector in recent months and signals increasing participation in Cardano’s decentralized finance ecosystem. 

Cardano Stablecoin Market Cap Soars

USDCx Fuels Cardano Stablecoin Valuation 

The surge came only days after an unidentified user bridged more than $10 million worth of USDCx onto the Cardano blockchain. Several ecosystem participants highlighted the transaction, including Cardano DeFi aggregator DEX Hunter.

Meanwhile, additional USDCx tokens have continued to enter circulation on Cardano. Data shared by SNEK co-founder Rami indicates that roughly $4.5 million worth of USDCx was minted on the network within two days, further strengthening stablecoin liquidity. As a result, the fresh capital inflow has deepened liquidity across the ecosystem.

USDCx, the Circle-backed stablecoin introduced to Cardano earlier this year, has quickly established itself as the dominant stable asset on the network.

Currently, USDCx commands a market share of 59.38%, accounting for $35.85 million of Cardano’s total $60.39 million stablecoin market cap. The rapid growth highlights increasing adoption of the asset as users seek seamless access to cross-chain liquidity within the ecosystem.

Stablecoin Growth Supports Total Value Locked

The rise in stablecoin liquidity also lifted Cardano’s total value locked (TVL), which climbed to approximately $82 million earlier this week before retreating to around $75 million following the latest decline in ADA’s price.

Despite the pullback, analysts believe the recent increase in stablecoin reserves provides a stronger foundation for future DeFi expansion on the network. Cardano research analyst Dr. Cuadrado believes the recent influx of stablecoin liquidity marks the beginning of a major growth phase for the ecosystem.

According to him, the most explosive stage of the current bull market could begin once Cardano’s stablecoin market cap surpasses its total value locked. He argued that such a development would signal the presence of excess liquidity waiting to be deployed across decentralized applications.

In his view, higher stablecoin reserves would lead to deeper liquidity pools, increased borrowing and lending activity, larger trading volumes, and more attractive yield opportunities across the network.

ADA Remains Under Pressure Despite Improving Fundamentals

Meanwhile, ADA continues to face bearish pressure despite the improvement in on-chain metrics. The asset has gradually slipped down the global cryptocurrency rankings and currently stands as the world’s 18th-largest crypto by market cap.

At press time, ADA had a market valuation of $5.53 billion and traded at $0.1519 per token, representing a 35.43% decrease over the past month.

Shiba Inu: Shibarium Daily Transactions Sink to 1,170, SHIB Down 95% From Peak

Shiba Inu layer-2 blockchain, Shibarium, is facing scrutiny as on-chain data highlighted slowing network activity, limited token burns, and stagnant holder growth.

The slowdown comes as SHIB’s price continues to underperform. The meme coin is trading at low levels last seen in 2021, while investor attention shifts toward artificial intelligence-related crypto projects.

Shibarium Network Activity Cools

Recent data from ShibariumScan suggests network activity has slowed considerably compared to the expectations that surrounded Shibarium’s launch.

The blockchain has processed more than 1.56 billion transactions and created nearly 270 million wallet addresses since going live. However, daily transaction volume has fallen to around 1,170 transactions. That marks a sharp decline from earlier periods of stronger activity.

The slowdown has fueled concern within the Shiba Inu community.

Source: https://shibariumscan.io/

Shiba Inu Burns Fall Short of Expectations

Critics have also pointed to the pace of SHIB token burns. According to Shibburn data, about 410.84 trillion SHIB have been burned since the token launched. That represents roughly 41.08% of the original 1 quadrillion supply.

However, burn activity linked specifically to Shibarium remains relatively modest. Around 1 billion SHIB have reportedly been burned through the layer-2 network, despite expectations that Shibarium would significantly accelerate the burn mechanism.

Recent burn data shows about 2.32 million SHIB were burned over the past 24 hours. Around 19.35 million were burned during the past week, while roughly 110.02 million were removed over the last 30 days.

Supporters have long viewed Shibarium’s ecosystem as a catalyst for increasing SHIB burns through transaction fees. So far, however, burn levels remain well below expectations seen when the network launched.

Source: https://www.shibburn.com/

Holder Growth and Price Remain Weak

Critics also argue that wallet growth has stalled. SHIB’s holder count has reportedly remained around 1.5 million for roughly 18 months.

SHIB’s price has also stayed under pressure. The token is trading at approximately $0.0000054. It is down 5.5% over the past week, 22% over the past month, 63% over the past year, and about 95% below its all-time high.

The combination of slowing network activity, modest burn rates, stagnant holder growth, and a declining price has led some market participants to question whether Shibarium can still become the ecosystem’s long-awaited utility engine.

Others remain optimistic. Future ecosystem upgrades, new decentralized applications, additional partnerships, and a crypto market recovery could revive activity. 

Bitcoin Closes Below 200Week Moving Average for First Time Since 2022: What Next?

0

Bitcoin has closed a candle below its 200-week moving average (200WMA) for the first time since June 2022, and this could determine its next course of action. 

The latest weekly close came in at $59,486, which sat below the 200WMA at $62,443. Since then, Bitcoin has struggled under $60,000 and now trades about 53% below its all-time high of $126,000, reached on Oct. 6, 2025.

The 200WMA, which tracks around 1,400 days of price data, has long helped traders separate bull markets from bear markets. When Bitcoin falls below this level, it indicates a shift in the long-term trend. As a result, this recent breakdown could dictate Bitcoin’s next price action.

Bitcoin 2022 Cycle Suggests Further Downsides

Historical patterns surrounding Bitcoin provide mixed data on what comes next, especially whether the crypto firstborn has finally found a cycle bottom or whether steeper declines could emerge.

Notably, the last time this breakdown occurred was in 2022. Specifically, in the second week of June 2022, the price closed at $20,552, while the moving average stood near $22,300. After that, the market fell further, reaching a low of $16,500 in November 2022.

At that point, Bitcoin traded at about 0.68 times the 200WMA and had dropped roughly 77% from its previous high of around $69,000. 

The price then stayed below the moving average for 16 months before finally moving back above it in October 2023. A similar path could play out if current support levels break.

The February 2026 low of $59,967 now acts as the first support level to watch. If this fails, attention shifts to the realized price near $54,000, which could present stronger support. 

However, if Bitcoin follows the same pattern as 2022 and again reaches 0.68 times the 200WMA, the price could fall toward the $41,000 to $42,000 range before finding a bottom.

Reason for Optimism

However, other cycles present bullish data. For context, Bitcoin has only moved below the 200WMA four times: 2015, 2018/2019, the March 2020 COVID crash, and June 2022. 

Interestingly, in three of those cases, specifically 2015, 2018/2019, and March 2020, the move happened close to the market bottom and was followed by new all-time highs within about 12 to 24 months. Only 2022 saw steeper declines after the breakdown.

Bitcoin Breakdown Below 200WMA

Michael Saylor, chairman of Strategy, continues to support the bullish view, insisting that Bitcoin’s cycle bottom may be around $60,000. He believes that money is not leaving Bitcoin but is instead shifting into other areas like artificial intelligence. 

He estimates that about $400 billion has moved into AI infrastructure. Strategy itself holds 843,706 BTC, although its average purchase price of around $75,000 means the position currently sits at a loss, which adds some context to his outlook.

Technically, Bitcoin has also shown some support. The price recently held just above $57,802, which matches the 61.8% Fibonacci retracement of the move from the November 2022 low to the October 2025 high. This level often attracts buyers and can act as a turning point.

What Traders Should Watch Next

Bitcoin’s next move will depend on how it behaves around the 200WMA in the coming weeks. If it manages to close back above the $61,000 to $62,500 range, it would match past cycles like 2015, 2018, and 2020, where the market recovered after a period of fear.

If the price stays below this level, the chances of a longer downturn increase, similar to what happened in 2022. Factors like ETF flows, options market activity, and key price levels like $59,967 and $54,000 will play an important role in deciding whether Bitcoin stabilizes or continues to move lower.

XRP Whales Are Actively Selling Amid Rising Network Activity

0

The recent surge in XRP network activity appears to be large-scale holders distributing their stash rather than accumulating, according to analysis.

A recent report from The Crypto Basic confirmed that active XRP addresses have surged 36% in the past two weeks. The number of daily users on the XRP Ledger moved from 27,205 to 37,202 addresses, suggesting growing network adoption.

However, while this appears bullish, recent analysis tells a different story. Rather than a positive signal, there could be a bearish development beyond the surface.

XRP Whales’ Sales Behind Network Spike

An analysis from Ali Martinez suggests that the spike in active addresses could be whales actively distributing their holdings. According to him, the increased activity came from large holders moving their funds to exchanges for possible sales.

He highlighted a previous tweet showing that whales distributed over 30 million XRP tokens during the period when the network activity spiked. This supports the narrative that the active addresses were likely whales reactivating to sell amid the persistent price downside.

However, several on-chain data points conflict with this. Coinglass XRP spot flows show that over the past 15 days, more coins have left exchanges than flowed in. Outflows stood at $1.43 billion and inflows at $1.35 billion, culminating in a net of $74 million withdrawn within the period.

XRP Spot Flows/Coinglass

Additionally, exchange reserves seem to be dropping too. On Binance, XRP’s reserve dropped to a 4-month low, showing that holders are moving their stash off exchanges. Recent data indicates that whales are responsible for most of the transfers, another bullish indicator.

XRP Gearing Up for a Decisive Move

Over the past few days, several indicators have been pointing to an impending price move in the XRP price. On Monday, The Crypto Basic highlighted a combination of the TD Sequential, falling channel, and morning star Doji as indications of an imminent rebound.

However, prices have not been moving in one direction lately. After a 1% increase yesterday appeared to be setting an uptrend in motion, XRP has dropped 1.40% so far today, relinquishing all of its gains yesterday.

Around the current price of $1.04 are two critical levels ahead. If a short-term rebound occurs, XRP could target the resistance at $1.27 and $1.35, where large amounts of tokens were moved according to URPD data.

XRP 1D Chart
XRP 1D Chart

On the contrary, losing the $1 support opens the path for a deeper correction to $0.80 and $0.62, where 923 million XRP and 1.16 billion XRP changed hands, respectively.