Home Blog Page 78

Three Bitcoin Metrics and the Halving Calendar Suggest Bottom Not Yet Confirmed

0

Three reliable Bitcoin metrics as well as the Bitcoin halving calendar suggest the market may not have reached its bottom yet.

Bitcoin is trading at about $59,800, leaving the largest cryptocurrency roughly 53% below the all-time high it reached in October 2025. Amid the downturn, investors continue to question if the market has found a bottom yet.

However, three reliable on-chain indicators suggest the answer is still no, as they remain above the levels that marked previous cycle lows.

Bitcoin NUPL Not Yet in Negative Capitulation Zone

The first indicator is the Net Unrealized Profit/Loss (NUPL), which measures whether holders, on average, sit in profit or loss by comparing Bitcoin’s market value to its realized value. 

At press time, the metric has dropped to 0.11, placing it in the Hope/Fear zone, but not yet in the negative Capitulation zone that appeared during the deepest parts of the 2018 and 2022 bear markets.

Bitcoin NUPL Coinglass
Bitcoin NUPL | Coinglass

Long-Term Holder NUPL, which focuses only on long-term investors, shares similar data points. The indicator fell to about 0.19 in early June 2026, but it never dropped below zero during this cycle. 

This is in contrast to November 2022, when the same metric fell to around -0.24, showing that long-term holders were sitting on overall losses.

Bitcoin MVRV Z-Score and Puell Multiple

The second metric suggesting that the bottom may not yet be in is the MVRV Z-Score. Notably, this indicator shows how far Bitcoin’s market value deviates from its realized value. 

The metric has slumped to 0.22 at press time. This suggests that Bitcoin is trading close to fair value, but not at the deeply undervalued levels seen at earlier cycle lows.

Bitcoin MVRV Z Score Coinglass
Bitcoin MVRV Z Score | Coinglass

For instance, when Bitcoin hit the $15,000 bottom in November 2022, the MVRV Z-Score dropped to -0.286. Meanwhile, during the COVID-19 bottom of around $5,000 in March 2020, the Z-Score hit -0.20.

The third indicator, the Puell Multiple, which tracks miner profitability, reached 0.51 on June 3. However, the reading was still above 0.5, the level that has historically signaled miner capitulation. 

Bitcoin Puell Multiple Coinglass
Bitcoin Puell Multiple | Coinglass

Although all three indicators have moved lower during the ongoing correction, none has reached the extreme levels that previously confirmed a market bottom.

Bitcoin Halving History Suggests Bottom Later This Year

Meanwhile, Bitcoin’s four-year halving cycle provides some pointers that could help investors evaluate when the cycle bottom could emerge. 

The latest halving took place in April 2024, and data from the previous three cycles shows that Bitcoin usually reaches its bull-market peak about 12 to 18 months after a halving. Bear-market bottoms have typically followed 24 to 28 months after the same event.

This cycle has followed that pattern. Specifically, Bitcoin reached its high in October 2025, about 18 months after the April 2024 halving. 

Using the same 12-to-15-month peak-to-bottom period seen during the 2018 and 2022 bear markets points to a likely bottom between October 2026 and January 2027. Within that range, Q4 2026 appears to be the most likely period for the cycle low.

Analysts and Historical Trends Support the Same View

Several respected research firms and industry experts have reached a similar conclusion. Research from CryptoQuant and Glassnode, along with analysis from Benjamin Cowen and PlanB, all mention the fourth quarter of 2026 as the most likely time for Bitcoin to form its bottom. 

December also stands out because Bitcoin reached major bear-market lows near $3,200 in December 2018 and around $15,500 during the November 2022 capitulation. 

Based on those historical patterns, the current cycle appears to be about four to six months away from its likely bottom, not just four weeks.

Previous Bitcoin drawdowns also suggest that further declines could still play out. The cryptocurrency lost about 94% during the 2011-2012 bear market, 87% in 2013-2015, 84% in 2017-2018, and 77% in 2021-2022. 

If this long-term pattern continues, this cycle could end with a decline of roughly 60% to 70%, which would place Bitcoin’s bottom somewhere between the high-$30,000s and the low-$50,000s, based on the $126,000 cycle peak.

XRP Whales Are Moving Coins Off Exchanges Faster Than Retail Holders, New Data Shows

0

XRP whales are moving coins off centralized exchanges at a more pronounced pace than retail users, suggesting large-scale accumulation.

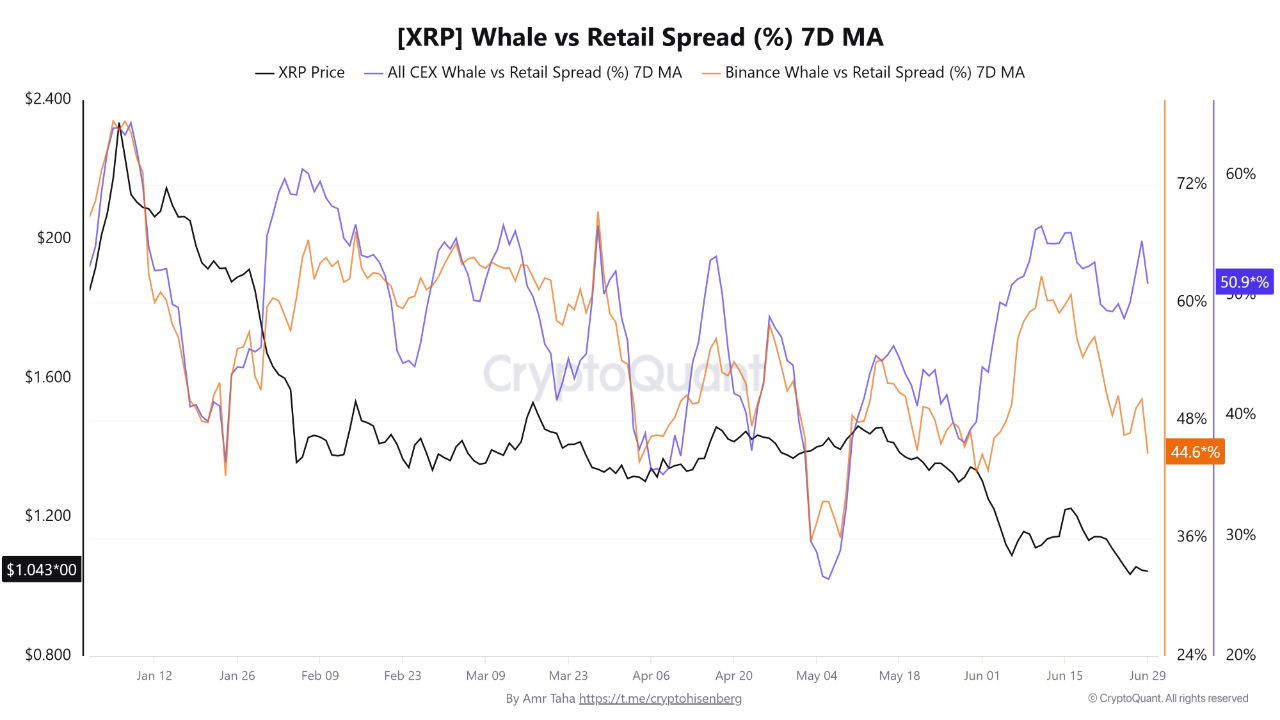
Notably, the gap in activity between these two classes of XRP holders has widened significantly over the past weeks, data from CryptoQuant shows. The data, shared by verified author Amr Taha, tracks the 7-day moving average of the XRP Whale vs. Retail Spread. 

Per the analysis, whale-sized withdrawals have become increasingly dominant across centralized exchanges. The all-CEX reading rose from 26.0% on May 6 to 50.9% on June 29, an increase of 24.9% points.

XRP Whales Moving Tokens from Exchanges

For context, the Whale vs. Retail Spread measures the difference between XRP outflows from transfers exceeding 100,000 XRP and those involving 100,000 XRP or less. A higher reading indicates that large holders account for a greater share of exchange withdrawals compared with retail participants.

As such, the 24.9% increase suggests that there have been more whale transfer activities across all exchanges than retail holders. Essentially, while retailers are on the sidelines amid the price uncertainty, large holders are moving XRP more prominently off exchanges.

XRP Whale vs Retail Spread/CryptoQuant

Nonetheless, the data does not reveal why whales are withdrawing XRP or where they are ultimately moving the coins. Large transfers could reflect movements to self-custody wallets, institutional custody restructuring, or other operational activity.

However, recent on-chain data suggests the recent shift could be to self-custody wallets. According to the data, there has been an uptick in active receiving addresses on the XRP Ledger, showing that more unique wallets are actively becoming recipients of the coin across the network.

Binance XRP Whale Activity Declines

While whale withdrawals have become more prominent across the wider exchange market, Binance has experienced a different pattern.

The exchange’s Whale vs. Retail Spread declined from 62.0% on June 11 to 44.6% on June 29, a drop of 17.4% points. That places Binance 6.3% points below the broader all-exchange average of 50.9%.

The figures suggest that although whales continue moving XRP off exchanges more actively than retail users overall, those transfers are becoming less concentrated on Binance and increasingly distributed across other centralized platforms.

Binance is the largest crypto exchange by trading volume and one of the largest sources of XRP trading activities. However, whales appear to be moving on from the platform to other similar exchanges, reflected in the drop in Binance’s share of the recent large-scale XRP transfer activity.

Cardano Founder Defines Long-Term Success Vision for ADA

0

Cardano founder Charles Hoskinson has outlined what he considers the ultimate measure of success for the Cardano ecosystem and its native token, ADA.

The Cardano founder has repeatedly emphasized his determination to see the blockchain succeed, describing that mission as his life’s work. In his recent commentary, Hoskinson offered fresh insight into how he defines success for the ecosystem he created.

Success Means Returning to Previous Highs and Moving Beyond Them: Hoskinson

According to Hoskinson, success involves returning Cardano to its former highs before pushing the network far beyond those levels. He argued that the blockchain’s true achievement would come when Cardano emerges as the world’s leading blockchain protocol.

In his view, reaching that position would fulfill Cardano’s long-term vision while validating the strength of its technology, community, and broader ecosystem. Hoskinson further stressed that becoming the dominant blockchain network would allow Cardano to drive meaningful global change. He believes the platform can transform industries and positively influence society on a global scale.

For him, success is not simply a matter of price appreciation or market capitalization. Instead, it centers on building technology capable of changing the world through decentralization and innovation.

Bear Market Challenges Weigh on ADA Performance

Despite ongoing market difficulties, Hoskinson has not softened his ambitions for Cardano. The prolonged bear market has affected investors across the industry, including himself.

For context, ADA currently trades around $0.1441, representing a decline of 95.34% from its previous all-time high of $3.10 reached in September 2021. Additionally, the asset has fallen 5.55% over the past week and 39.1% over the past month, highlighting the intense bearish pressure facing the ecosystem.

At the same time, Cardano has slipped out of the top ten cryptocurrencies by market capitalization. After spending years among the industry’s largest assets, ADA currently occupies the 18th position in the global cryptocurrency rankings.

For ADA to revisit its previous all-time high of $3.10, the asset would need to rally approximately 2,052% from current levels. Such a move would theoretically increase Cardano’s market cap to roughly $112.84 billion.

Assuming competing assets remain relatively unchanged, that valuation would likely propel Cardano to the fourth-largest position in the global cryptocurrency rankings, surpassing BNB, which is valued at $74 billion.

Hoskinson Believes Cardano Can Surpass Bitcoin

Although many observers consider the target ambitious, Hoskinson continues to insist that Cardano can eventually become the leading cryptocurrency network, even surpassing Bitcoin. He argues that sustained investment and continued ecosystem growth could make that objective achievable over time.

Critics, however, have dismissed Hoskinson’s projections as overly optimistic. Some highlighted his previous warnings about a potential wave of failures among Cardano-based projects as evidence that the ecosystem still faces substantial challenges.

As a result, they argue that overtaking Bitcoin and becoming the industry’s dominant blockchain remains an unrealistic objective.

Hoskinson Continues to Back Cardano’s Technology

Nevertheless, Hoskinson remains unwavering in his confidence. He maintains that Cardano will eventually surpass its previous highs while delivering transformative global impact through its decentralized infrastructure.

In addition, he pointed to the network’s core technologies, including the Extended UTXO (EUTXO) accounting model, its proof-of-stake consensus mechanism, decentralized on-chain governance, and the Midnight project, as key drivers that could reduce the global cost of trust. 

XRP Long-Term Fibonacci Targets Align With Standard Chartered and Bitwise 2030 Forecasts

XRP analyst ChartNerd has noted that long-term price forecasts from major financial institutions broadly align with Fibonacci extension targets for 2030.

Notably, the comparison comes as XRP trades at $1.04. The token is down 6% over the past week, 21% over the past month, and 43% year-to-date. The decline follows the overall weakness in the crypto market despite optimistic long-term projections.

Standard Chartered Keeps $28 Target for 2030

ChartNerd’s recent analysis highlighted forecasts from Standard Chartered and Bitwise. Notably, the bank expects XRP to reach $28 by 2030, even after lowering its near-term outlook earlier this year.

Geoffrey Kendrick, the bank’s global head of digital assets research, cut his 2026 XRP target from $8 to $2.80 after the token fell substantially amid the 2026 bear market. While reducing the short-term forecast, he raised his longer-term projections.

Under the updated roadmap, Standard Chartered expects XRP to reach $7 in 2027, $12.60 in 2028, $19.60 in 2029, and $28 in 2030. For context, a $28 XRP price would give the token a market capitalization of roughly $1.7 trillion.

The bank said the $2.8 target for 2026 depends largely on a recovery in the crypto market. Its longer-term forecasts assume stronger institutional adoption, spot XRP ETF inflows, and regulatory clarity.

Bitwise Sees Bull Case at $12.68, Max Case at $29.32

Meanwhile, asset manager Bitwise has also published multiple XRP scenarios through 2030. The forecasts are based on a valuation framework using the Capital Asset Pricing Model (CAPM).

Instead of setting a single price target, Bitwise modeled three outcomes based on adoption, regulation, and overall crypto market growth.

Its bear case sees XRP falling to $0.13 by 2030 if adoption in payments and tokenization remains limited.

In the bull case, Bitwise projects XRP reaching about $12.68 by 2030, assuming steady growth and limited regulatory setbacks.

Its most optimistic scenario places XRP at $29.32. That outcome assumes XRP captures a meaningful share of the global payments and real-world asset tokenization markets. Under this scenario, XRP’s market capitalization would approach $2 trillion.

Bitwise added that XRP would not need to dominate either market to justify substantial upside. Even modest penetration into trillion-dollar payments and tokenization markets, combined with higher network activity and XRP’s fee-burning mechanism, could support long-term value growth.

Technical Targets Point to Similar Levels

In his post, analyst ChartNerd shared a chart comparing these institutional forecasts with long-term Fibonacci extension levels.

According to the analyst, Standard Chartered’s and Bitwise’s projected price levels, around $8, $12, $28, and $29, closely match the chart’s Fibonacci extension targets for 2030.

Image

The analyst described the comparison as a “thought experiment” rather than a price prediction and stressed that the projections remain speculative.

While the similarity between institutional forecasts and technical analysis is exciting, the outlooks of Standard Chartered and Bitwise depend on several factors. These include favorable regulation, institutional adoption, ETF demand, macroeconomic conditions, and the overall performance of the crypto market.

At the moment, XRP remains below those long-term targets as the bear market bites harder.

Hoskinson Says “I’m the Guy Who Has Been Here Since Day One,” Reaffirms Commitment to Lead Cardano

0

Charles Hoskinson has reaffirmed his commitment to leading Cardano through its next phase of growth.  

His remarks come amid growing criticism from parts of the community, with some critics urging him to step down following a series of ecosystem setbacks, including project shutdowns and governance disputes. 

In the commentary, Hoskinson dismissed those calls and insisted that millions of community members still look to him for guidance and leadership. According to him, these supporters represent the “silent overwhelming majority” of the Cardano ecosystem.

The majority, in his view, include users, developers, and stakeholders, who believe he can help solve problems, provide direction, and guide the network through difficult periods. 

“I’m the guy who’s been here since day one and before,” Hoskinson said, adding that this long-standing involvement is a key reason he continues to lead Cardano. 

Governance Enhancement Emerges as Cardano’s Next Priority

Meanwhile, Hoskinson identified governance reform as Cardano’s most important objective moving forward. In his view, the ecosystem has reached a stage where stronger governance structures are essential for long-term sustainability and growth. 

As the creator of the protocol and one of the key figures behind its launch, community expansion, and fundraising efforts, Hoskinson believes he has both the experience and responsibility to push these reforms forward.

His call for governance improvements follows weeks of disputes surrounding treasury allocations and strategic priorities within the ecosystem. Several governance disagreements have highlighted growing tensions within Cardano’s decentralized decision-making system.

For example, some DReps, including some Iagon execs, opposed key proposals backed by IOG. In addition, the community failed to approve funding for the 2026 Cardano Summit, further exposing divisions over spending priorities.

Proposed Reforms 

In response, Hoskinson has proposed several changes aimed at improving coordination and accountability across the ecosystem. Among them is a proposal to move the Cardano community’s governance-related discussions from X to a moderated Discord environment. However, critics argue that such a move could conflict with Cardano’s decentralization principles by introducing greater moderation over community discussions.

Hoskinson also indicated that he may become a DRep himself to vote on funding proposals directly. He described the potential move as an accountability mechanism rather than an attempt to consolidate power.

Furthermore, he has advocated for a revised Cardano constitution featuring clearer executive responsibilities, elected authority structures, and measurable growth objectives.

Unity Will Determine Cardano’s Future

Despite the ongoing disputes, Hoskinson believes governance reform represents the next logical step in Cardano’s evolution, particularly as the network continues its transition toward greater decentralization and community participation.

He also emphasized the importance of unity across the ecosystem, warning that internal divisions could undermine Cardano’s ambitions and slow progress during a critical stage of development. 

Another 30% XRP Correction? What History Says About the Current 70% Price Drop

0

XRP has dropped 70% from its all-time high amid a prolonged sideways trend, but history highlights a more concerning recurring trend.

The July 2025 all-time high of $3.66 not only marked a new all-time high for XRP but also the price peak for the bull cycle. Since it reached this level, the sixth-largest cryptocurrency by market cap has only trended lower to multi-year levels.

Currently at $1.04, XRP has now dropped 71.4% from the peak price, a correction only seen in deep bear market cycles. Meanwhile, a recurring trend that has historically followed such a retracement suggests the storms might not be over for the altcoin.

XRP 1M Chart/TradingView

What Past Events Show About a 70% Drop

A 70% decline from its peak is not unprecedented for XRP. In fact, after every major bull market in the historical four-year cycle, the asset has experienced corrections of similar magnitude.

But does a 70% pullback from its peak price mean that XRP is nearing its bottom? Past events suggest otherwise.

Take, for instance, in 2018, when XRP peaked at $3.35 in January 2018. By February that same year, it had dipped to a low of $0.56 before closing at $0.88. From the peak price of the previous month to its February 2018 closing price represented an approximately 74% drop.

But that didn’t mark the bottom. XRP collapsed even further over several months to the bear market low of $0.10 in March 2020. That represented an approximately 90% decline from the February closing at $0.88. This resulted in another 90% drop after the initial 74% retracement.

Notably, this similar pattern repeated in the previous full market cycle. XRP reached a peak of $1.97 in April 2021. Two months later, the coin had dipped to a low of $0.508, representing a 74% decrease from the cycle’s high.

The dip didn’t stop there, as XRP continued to decline substantially. The asset finally bottomed at $0.28 in June 2022, a further 45% retracement after the initial 74% correction.

Will the Concerning XRP Trend Repeat?

With XRP dropping 71.5% from its July 2025 high at the current market price, analysts believe the dip might not be over, especially going with past precedents. Notably, the first event saw a 90% drop after the initial decline, and the second event saw half of the first drop at 45%.

If the pattern repeats, then XRP could drop by another 25% to 30%, taking its price to around $0.78 to $0.73. Notably, this outlook hinges completely on recurring market behaviors, and there is no certainty to it.

Moreover, there are conflicting outlooks. Recall that the initial drop in past events happened within the first two months of the peak. This time, it took XRP 11 months to retrace by 71% from the peak. 

Again, XRP crashed to $0.77 on Binance during the October 2025 flash crash, representing a 79% dump from the current ATH. Analysts argue this might pass for the initial dump, and the current dip is the latter part of a corrective phase rather than the start.

How XRP develops in the coming weeks will confirm which theory is correct. For now, the broader trend is bearish, with XRP holding above the $1 support nicely. Losing this demand zone opens the possibilities of a deeper correction.

Ex-Ripple CTO Says State-Backed XRPL Attack Would Be a ‘Financial Gift’ to XRP Holders

Ripple CTO Emeritus David Schwartz has defended his proposed solution for preventing front-running and sandwich attacks on the XRP Ledger (XRPL). 

He argued that even a state-sponsored attacker would struggle to make such an attack practical.

His comments came after X user @0xSCSamurai criticized the proposal. The user claimed its denial-of-service (DoS) protections would be ineffective because well-funded state actors could keep attacking the network indefinitely.

Schwartz rejected that argument. He said that if such an unlikely scenario ever occurred, the network could simply raise the cost of the attack.

“If that happens, we can just raise the cost of the attack, and it would either stop or be, in effect, a huge financial gift from state actors to XRP holders,” Schwartz wrote.

He also said the fee escalation mechanism could be adjustable through governance instead of being permanently fixed.

Proposal Would Let XRP Ledger Validators Adjust Fees

To strengthen the design, Schwartz proposed making the fee escalation system configurable through the XRPL’s existing voting process.

Under this approach, validators could adjust the parameters that control how reservation fees increase as transaction slots fill up. According to Schwartz, this would allow fees to rise only as much as necessary to discourage abuse without placing unnecessary costs on regular users.

He also questioned the assumption that a government-backed attacker would be willing to spend large amounts of money simply to keep the network at its current level of security.

How the Reservation System Would Work

The discussion follows a detailed proposal Schwartz published earlier to eliminate front-running and sandwich attacks on XRPL payments and offer crossing.

His proposal introduces a new ReservedTxns ledger object and a TxnReserve transaction type.

Users could reserve an execution slot for a future ledger by paying at least twice the standard transaction fee. Reservations would only be valid for ledgers up to 16 ledger intervals in advance. Initially, each ledger would support up to 32 reserved transaction slots.

After reserving a slot, a transaction would be broadcast only after the previous ledger’s consensus process is effectively complete. This would prevent attackers from seeing the transaction early enough to insert competing transactions ahead of it.

During ledger execution, reserved transactions would be processed before the normal transaction set. They would then be removed from the reservation list, ensuring they execute in the intended order.

Rising Fees Aim to Prevent DoS Attacks

Schwartz acknowledged that an attacker could theoretically reserve every available transaction slot across multiple future ledgers. That could prevent others from using the protection mechanism.

To address this risk, he proposed gradually increasing reservation fees as available slots become scarce.

In his example, fee increases would begin once 16 of the 32 reservation slots had been filled. The fees would rise linearly until reaching three times the base reservation fee when 30 slots were occupied.

If demand increased, the reservation limit could also be expanded from 32 to 64 slots.

According to Schwartz, the escalating costs would make sustained attacks expensive. An attacker would have to spend several times more than legitimate users typically would to reserve transactions.

If an attacker still chose to continue, Schwartz argued that the fees collected would ultimately benefit the XRP Ledger ecosystem and, by extension, XRP holders.

Is This the Worst Bitcoin Halving Cycle? What the Data Says

0

Most traders insist that this is the worst Bitcoin halving cycle in history, but data indicates the comparison may come from a skewed starting point.

These concerns have emerged due to Bitcoin’s (BTC) performance since its fourth halving on April 19, 2024. The crypto asset now trades at $59,400, below the roughly $64,000 price it held on the day of the halving. 

Bitcoin Halving-Day Buyers Still Underwater

This indicates that more than 800 days later, investors who bought Bitcoin on halving day are still sitting at a loss. This is the first time in Bitcoin’s history that halving-day buyers have remained underwater this far into a cycle. In every previous cycle, they were already in profit by this stage.

Bitcoin’s drop from its peak has also added to the concerns. Specifically, the crypto firstborn has fallen about 53% from its all-time high of around $126,000, reached on Oct. 6, 2025. 

Now, while this decline is still smaller than the drops of more than 77% that followed the market peaks in 2018 and 2022, Bitcoin has not delivered the strong gains the market recorded in earlier cycles.

Skewed Starting Point

However, the halving date is a skewed starting point because this cycle began under conditions Bitcoin had never experienced before. Notably, BTC had already reached a new all-time high of $73,800 on March 12, 2024, more than a month before the fourth halving.

This was a major change from previous cycles. In earlier halvings, Bitcoin had not yet moved above the previous bull market’s peak by the time the halving took place. As a result, on the halving day, the market still had room to climb before reaching new highs. This cycle followed a completely different path.

A major reason for the difference was the launch of U.S. spot Bitcoin ETFs in January 2024. These funds attracted massive institutional demand well before the halving reduced Bitcoin’s new supply. On the halving day, they had already attracted $12.3 billion in cumulative net inflows.

This early buying pushed Bitcoin’s price much higher before the halving even arrived, creating an unusually high starting point. 

Realized Price Presents a Better Way to Compare Cycles

Many analysts consider realized price a better benchmark because it does not react as quickly to single events. Specifically, realized price measures the average cost of all coins in circulation based on the price at which each coin last moved on-chain.

Since realized price changes gradually as investors buy and sell Bitcoin, it is less affected by major events such as ETF approvals. This makes it a more stable way to compare different market cycles without the distortion created by Bitcoin’s unusually strong rally before the halving.

Bitcoin Halving Cycles

Bitcoin’s realized price currently stands at $53,197, while the spot price is around $59,400. That means the spot price trades at a premium of roughly 10% above the realized price, one of the smallest gaps seen during this cycle. 

In past cycles, Bitcoin reached major market bottoms when the spot price moved this close to the realized price, including the lows recorded in 2015, late 2018 into 2019, and 2022.

Bitcoin Realized Price Still Shows This Has Been a Weak Cycle

Nonetheless, even after removing the effect of Bitcoin’s early rally, realized price does not make a bullish case for this cycle. Instead, it still points to weaker performance than previous halving periods.

During this cycle, the Bitcoin market price never moved far above realized price the way it did during the major bull market peaks of 2013, 2017, and 2021. 

In those earlier cycles, heavy speculation pushed Bitcoin’s market value several times above the combined cost basis of all coins. Such a gap never developed this time, even when Bitcoin reached its record high in October 2025.

The smaller gap between spot price and realized price suggests this market has behaved differently from earlier ones. The current cycle has been shaped by steady institutional buying through spot Bitcoin ETFs instead of being driven mainly by retail speculation. 

It is still too early to know whether this will lead to a smaller market bottom or simply a quieter bull market. However, while using realized price instead of the halving-day price removes the distortion caused by ETFs, it still indicates that the cycle has been worse than others at similar periods.

Ripple CEO Slams Strategy Says Financial Engineering Will Not Drive Long-Term Value

0

Brad Garlinghouse, CEO of Ripple, argued that the long-term success of digital assets depends on real-world utility rather than financial engineering.

Garlinghouse reiterated this position in a tweet yesterday, following his recent appearance on CNBC’s Squawk on the Street, where he stated, “Financial engineering doesn’t drive long-term value. Utility does.”

His remarks directly challenged the financial strategies employed by Strategy and its chairman, Michael Saylor, who has aggressively expanded the company’s Bitcoin holdings through debt offerings and preferred stock issuances.

Garlinghouse Criticizes Strategy’s Bitcoin Accumulation Model

During the CNBC interview, Garlinghouse argued that creating increasingly complex financial products to fund additional Bitcoin purchases does not generate sustainable value for investors or the broader crypto industry.

Specifically, he highlighted Strategy’s preferred stock offering, STRC, which the company designed to trade close to its $100 par value while offering an 11.5% annual dividend yield. However, the security traded near $74 during the interview period, representing a decline of roughly 26% from its intended valuation.

According to Garlinghouse, this performance reflected weakening investor confidence in a business model heavily dependent on leverage and financial structuring to acquire more Bitcoin.

He went further, describing STRC’s decline as a “damning indictment” of Strategy’s funding strategy and accusing the company of damaging the broader cryptocurrency market. Despite these criticisms, Garlinghouse emphasized that he remains bullish on Bitcoin’s long-term future.

Real-World Utility Drives Sustainable Value

Meanwhile, Garlinghouse stressed that cryptocurrencies derive lasting value from practical use cases rather than speculative financial mechanisms.

In his view, digital assets that facilitate payments, power decentralized applications, support tokenization initiatives, or solve real business problems stand a much better chance of maintaining relevance over time.

This philosophy aligns closely with Ripple’s business model. The company promotes XRP as a solution for improving the speed, cost, and efficiency of international payments. During the interview, Garlinghouse revealed that Ripple processed $16 trillion in payments last year, a figure supported in part by the company’s acquisition strategy.

Strategy Faces Mounting Financial Pressure

Meanwhile, recent figures appear to support Garlinghouse’s concerns regarding Strategy’s Bitcoin accumulation strategy. 

The company’s annualized dividend obligations across its preferred share classes have increased to $1.2 billion. Last month, Strategy sold 32 BTC to help fund an STRC dividend payment, marking its first Bitcoin sale in years.

The transaction triggered a sharp market reaction and contributed to a broader cryptocurrency sell-off that temporarily pushed Bitcoin below $60,000. However, Strategy later sought to calm investor concerns by resuming Bitcoin purchases in subsequent weeks. As a result, the company expanded its holdings to 847,363 BTC.

Strategy’s Recent Approach to Grow USD Reserve 

Recently, analytics platform CryptoQuant has also raised concerns about Strategy’s current trajectory. The firm recommended that Strategy temporarily halt additional Bitcoin purchases and instead focus on rebuilding its cash reserves as dividend coverage continues to tighten.

Although Strategy did not announce any new Bitcoin acquisitions yesterday, it disclosed that its U.S. dollar reserves had increased to $2.55 billion, which could cover 17.4 months of dividend payments. 

Yesterday, the company unveiled a Digital Credit Capital Framework aimed at strengthening liquidity further and preserving its Bitcoin exposure. Under the initiative, Strategy could potentially sell up to $1.25 billion worth of Bitcoin. 

While the program does not authorize an immediate sale of Bitcoin, it provides management with the flexibility to liquidate holdings when necessary to support the company’s broader capital strategy. 

Toobit Brings TradingView Charting Tools to Its Mobile App

0

Crypto exchange Toobit has expanded the trading capabilities of its mobile app by adding TradingView’s charting suite, giving users access to more advanced market analysis tools directly from their smartphones.

The integration is designed to make mobile trading more flexible by offering charting features that are commonly associated with desktop trading platforms. Through the new update, Toobit users can move between the app’s default chart view and TradingView charts depending on their trading style and analysis needs.

With the TradingView charting suite now available inside the Toobit app, traders can access multiple timeframes, apply technical indicators, and use drawing tools to study price action in greater detail. The update also supports full-screen and landscape chart viewing, creating a larger workspace for users who want a clearer view of market movements on mobile.

Key features introduced through the update include

Instant chart switching, allowing users to toggle between standard charts and TradingView charts from the trading screen.

Advanced technical analysis tools, including multiple timeframe options, trend lines, Fibonacci tools, and commonly used indicators such as MA, EMA, MACD, and RSI.

Expanded viewing modes, including full-screen and landscape chart layouts for improved visibility during market analysis.

Saved chart preferences, allowing users to keep their selected chart mode and indicator settings for future trading sessions.

To access the new feature, users can open the Toobit app, select any spot or futures trading pair, and tap the chart switch icon to move between the standard chart and TradingView charting interface.

The mobile rollout follows Toobit’s earlier support for TradingView-based tools on its broader platform. Existing functionality includes multi-chart layouts with support for up to eight charts, 18 chart types, and real-time alert synchronization through webhooks. By extending TradingView’s charting capabilities to the mobile app, Toobit aims to give traders a more complete technical analysis experience across devices.

The update comes as mobile trading continues to play a larger role in digital asset markets. Traders increasingly rely on real-time charting, technical indicators, and customizable analysis tools to respond to volatile market conditions. TradingView, which is used by more than 100 million people globally, has become one of the most recognized platforms for chart-based market analysis.

By adding TradingView charts to its mobile application, Toobit is positioning the app as a more capable tool for traders who want detailed market visualization without relying only on desktop platforms.

About Toobit

Toobit is a cryptocurrency trading platform offering derivatives markets, deep liquidity, AI-powered trading features, and access to both crypto and traditional finance-related markets. The exchange focuses on providing traders with a secure, transparent, and feature-rich environment for participating in digital asset markets.

For more information, visit website.

Media Contact: Davin C.
Email: market@toobit.com