Home Blog Page 79

Ripple Expands RLUSD Footprint in Indonesia as FLOQ Brings Stablecoin to 1.8 Million Users

Indonesia-based digital asset exchange FLOQ has expanded its partnership with Ripple by integrating Ripple USD (RLUSD) into its platform. 

The move marks another step in the stablecoin’s global rollout. Specifically, the integration brings RLUSD to FLOQ’s ecosystem of more than 1.8 million registered users.

The announcement came during FLOQ’s first anniversary event, The Genesis. At the event, the company outlined its next growth phase, which will focus on institutional adoption, real-world blockchain use cases, and trusted digital asset infrastructure.

FLOQ Introduces RLUSD to Indonesian Users

During the event, FLOQ confirmed that its partnership with Ripple will bring RLUSD to Indonesia’s digital asset ecosystem. The stablecoin supports blockchain financial applications, including payments, liquidity management, and other digital financial infrastructure.

The company also revealed that it has surpassed 1.8 million registered users. It further noted that it raised $11.3 million in a strategic funding round during its first year. This provides the resources to expand its ecosystem through partnerships with global blockchain companies.

Partnership Builds on Earlier RLUSD Listing

The announcement follows FLOQ’s earlier decision to list RLUSD on its licensed Indonesian platform and formally launch its partnership with Ripple.

At the time, FLOQ said stablecoins are becoming essential infrastructure for payments, settlements, and cross-border transfers as the digital asset industry matures. The company added that RLUSD combines fully backed reserves with blockchain efficiency to deliver an enterprise-grade settlement solution for Indonesian users.

FLOQ Founder and CEO Yudhono Rawis said RLUSD brings trusted, transparent, and practical utility to Indonesia’s digital asset ecosystem, particularly for settlements and value transfers. He added that FLOQ is proud to work with Ripple to support responsible digital asset adoption in the country.

FLOQ Highlights Ondo Finance Partnership

Alongside its Ripple collaboration, FLOQ also highlighted its partnership with Ondo Finance, which focuses on tokenized real-world assets (RWAs).

The company said tokenized financial products are among the fastest-growing segments of the digital asset industry. They help connect traditional financial markets with blockchain infrastructure while improving accessibility and operational efficiency.

Indonesia Pushes Toward Institutional Adoption

FLOQ said discussions during its anniversary event reflected the industry’s shift from retail crypto adoption to institutional participation and infrastructure development.

According to the company, its long-term strategy centers on responsible innovation, trusted partnerships, and close collaboration with regulators and industry participants.

Summing up FLOQ’s vision, Rawis said the anniversary was not a celebration of past achievements but the beginning of what the company plans to build for Indonesia’s digital asset ecosystem.

Ultimately, the Ripple partnership marks another milestone in RLUSD’s international expansion as the stablecoin continues entering regulated markets.
XRP TD Sequential, Falling Channel, and Morning Doji Star All Point to Imminent Reversal

0

XRP may be on track for a bullish reversal, according to pointers from the TD Sequential, a falling channel, and a Morning Doji Star candle pattern.

Since the broader crypto market entered a downtrend in Q4 2025, XRP has dropped 63% in value. The price has fallen from $2.84 in October 2025 to $1.05 at the time of writing. The latest wave of selling has also hurt its monthly performance, leaving XRP down 21.20% so far in June.

Amid this decline, three separate technical indicators now support the possibility of a recovery. These include a Tom DeMark (TD) Sequential buy signal, an attempted breakout from a falling channel on the daily chart, and the possible completion of a Morning Doji Star candlestick pattern.

TD Sequential Signals Selling Pressure May Be Fading

The first bullish sign comes from the TD Sequential indicator, which has printed a 9 candle on XRP’s daily chart. Notably, this indicator can indicate when a downtrend is losing momentum.

Specifically, a 9 candle appears after the market forms nine consecutive qualifying candles during a downtrend. When this happens, it suggests that sellers have lost momentum, increasing the chances of either a price rebound or at least a pause in the decline.

XRP TD Sequential
XRP TD Sequential

For XRP, the TD Sequential completed its 9-candle count on June 26. The signal appeared after the token fell from a local high of $1.29 on June 15 to a new yearly low of $1.00795 on June 26. Since then, XRP has stopped making new lows and has managed to recover slightly from the $1.00795 bottom.

Although buyers have not yet pushed the price high enough to recover the recent losses, XRP has held firmly above the $1.04 support level. 

The token has traded around that price for the past two days without breaking lower. If the TD Sequential buy signal proves correct, this period of stability could be the first sign that the market is preparing for a reversal.

XRP Tests the Top of a Falling Channel

Another signal also supports the bullish outlook. Notably, XRP is now trying to move above the upper boundary of a falling channel on the daily chart.

For context, a falling channel forms when an asset drops between two downward-sloping parallel trendlines. During this pattern, the price creates lower highs and lower lows, showing that sellers remain in control. However, a move above the upper trendline suggests that the downtrend is weakening.

XRP started forming this falling channel after facing resistance at $1.29 on June 15. From there, the latest market-wide correction pushed the price lower. XRP continued to post lower highs and lower lows until it reached the lower boundary of the channel on June 25.

XRP Falling Channel and Morning Doji Star

Since touching that support level, the token has started moving against the downward trend. The latest green daily candle is now attempting to break above the channel’s upper trendline. If buyers manage to confirm that breakout, it could support a bullish reversal.

Morning Doji Star Nears Completion

The third bullish signal comes from XRP’s daily candlestick chart. The token is now close to completing a Morning Doji Star pattern, which traders regard as a sign that a downtrend may be coming to an end.

This pattern forms after a decline and includes three candles. Specifically, it starts with a strong bearish candle, followed by a small doji that shows uncertainty in the market. A strong bullish candle then completes the pattern, showing that buyers may have regained control.

For XRP, the first bearish candle formed on June 27, when the token slipped 0.14%. The second candle appeared on June 28 as a doji. 

The third bullish candle is now playing out, with XRP already up 0.70% today. If buyers keep the momentum going and the session closes with a strong green candle, the Morning Doji Star pattern would be confirmed.

Together, the TD Sequential buy signal, the attempted breakout from the falling channel, and the possible confirmation of the Morning Doji Star all point to the same conclusion. If these signals receive full confirmation, XRP could be preparing for a rebound after weeks of steady selling pressure.

XRP Dip Buying Intensifies as Exchange Reserve on Binance Falls to 4-Month Low

0

The amount of XRP on exchanges is dropping fast, as whales and sharks appear to be heavily stacking the altcoin.

XRP is seeing increased accumulation, evident in the number of coins remaining on exchanges. Over the past several months, the amount held on Binance, the largest crypto platform by trading volume, has continued to decline, reaching levels last seen in four months.

XRP Reserve on Binance Reaches 4-Month Low

Data from CryptoQuant shows that the XRP exchange reserve on Binance has dropped to 2.64 billion tokens, about 4.2% of the asset’s circulating supply. While this is still sizable, it marks a notable decline from the figures recorded months back.

For context, Binance held roughly 2.8 billion XRP in its reserve in March. This figure reduced slightly before reaching a high of 2.78 billion in May. Today, the exchange’s XRP reserve has further dropped by 5% to 2.64 billion.

XRP Exchange Reserve/CryptoQuant

Notably, the last time the amount of the token held by Binance hit this low was in February, over four months ago. Then the exchange’s reserve reached 2.55 billion, as market users bought the market dip.

Now, the current reserve drop suggests that smart money is back to buying the dip. Market users are increasingly moving XRP from where it can be easily sold to self-custody wallets, possibly for long-term holding.

Such activity is bullish in every sense. Not only does it reduce selling pressure, but it also shrinks available supply. That way, steady demand would have more impact on prices than when a larger supply is in the market. Additionally, it reflects confidence in XRP’s mid- and long-term price prospects.

XRP Exchange Outflow Beyond Binance

Interestingly, the exchange outflow is not limited only to Binance. Coinglass data shows that over the past 10 days, a net total of $42.67 million has left trading platforms globally. During this period, inflows stand at $822 million and outflows at $864.6 million, culminating in the net difference.

This trend has extended even to recent data. In the last 24 hours, holders withdrew $69.84 million, larger than the inflows of $64 million by $5.78 million.

XRP Spot Flows/Coinglass

The accumulation is notable because it comes despite the ongoing correction. XRP is down 7% in the past 24 hours, joining a broader market trend. Yet, market users see each dip as an opportunity to buy more, looking beyond the short-term bearish trend.

Aligning Bullish Metrics

Other metrics also tick bullish for XRP. For context, active XRP addresses have increased 36% in the past two weeks as network activity improves. With more receiving wallets active on the XRPL Ledger, it also confirms that outflows are moving to long-term self-custody wallets.

Additionally, the TD Sequential also recently printed a buy signal on the XRP daily chart. This pattern confirms that selling pressure is nearing exhaustion, and a rebound could follow in the coming days.

XRP TD Sequentia Buy Signal/Ali Martinez

In the meantime, XRP trades at $1.05, holding above the $1 support.

XRP Network Activity Surges 36% in Two Weeks

0

Daily active addresses on the XRP Ledger have increased in the past two weeks, signaling stronger network usage despite XRP’s persisting price struggles.

Recent data shows that the number of daily XRP users has climbed steadily for a while now. Although the broader crypto market remains uncertain and the altcoin’s price has continued to slide lower, more people are using the XRP Ledger.

XRP Active Addresses Rise 36%

On June 14, the number of active XRP addresses stood at 27,205, according to data from market intelligence platform Santiment. However, on June 28, this metric had climbed to 37,202 addresses, a 36% increase.

XRP Daily Active Addresses/Santiment

For the uninitiated, the daily active addresses track the unique wallets using the XRP Ledger each day, reflecting adoption. When this increases, it shows that the network is becoming busier.

Interestingly, the metric has continued to increase over the last few days. For instance, on June 25, active addresses reached 41,490, levels last seen much earlier in the month. This meant that the earlier skepticism that followed the price decline is slowly fading, and users are trooping back to the network.

Furthermore, the active address metric has maintained its current level for most of 2026. While there have been several spikes and dips to reflect changing market situations, the number of users using the Ledger daily has averaged around 38,000.

This is notable considering that XRP has dropped 43% YTD. The consistency in network activity throughout the dip reflects real demand for the Ledger’s infrastructure.

Price Struggles Regardless, but There’s a Catch

Despite the increase in active users, the XRP price has continued to struggle. Since forming a lower high at $1.29 on June 15, the coin has dropped 19% to its current price of $1.04. This continues to build on the lackluster performance, which has seen XRP drop 21% so far this month.

However, there is a catch. Growing active addresses are usually bullish, as they reflect increasing adoption and user interest. When it pairs together with weak price action, a divergence emerges.

Rising network usage, especially during a price dip, might suggest accumulation. More addresses are activating on the XRP Ledger to buy the coin at a cheaper price. A corresponding increase in transaction volume confirms this.

Data from CryptoQuant shows another compelling metric. Active receiving addresses on the XRP Ledger stand at 39,916, far more than the active sending addresses at 12,676. This means that more unique wallets are actively accumulating XRP either through purchases, withdrawals from trading platforms, or P2P transfers.

XRP Trending Metrics/CryptoQuant

In the meantime, XRP is trading near the $1 support, with bulls consistently trying to defend this level. Should the downtrend persist, the next major supports are near $0.80 and $0.62.

Shiba Inu Whales Accumulate 500B SHIB as Price Slump Creates Buying Opportunity

0

Following the recent downturn in Shiba Inu’s price, whales have begun taking advantage of lower prices by aggressively accumulating SHIB at discounted levels.

Large investors are viewing the latest correction as a buying opportunity, withdrawing more than 400 billion SHIB tokens from exchanges within just a few days.

Exchange Outflows Accelerate Amid Price Weakness

Shiba Inu remains firmly in bearish territory, with the token plunging to a five-year low of $0.00000404 on June 25. Although the asset has attempted to stabilize since then, it has struggled to mount a meaningful recovery.

Interestingly, the price decline has coincided with a sustained wave of exchange withdrawals that began on June 25. The trend suggests that investors are using the dip to accumulate SHIB and move their holdings into private wallets rather than keeping them on trading platforms.

Nearly 500 Billion SHIB Leave Exchanges in Four Days

According to CryptoQuant’s exchange netflow metric, which measures the difference between exchange inflows and outflows, investors withdrew 158.35 billion SHIB from exchanges on June 25 alone.

The accumulation trend continued over the following days:

  • June 26: 85.72 billion SHIB withdrawn
  • June 27: 125.55 billion SHIB withdrawn
  • June 28: 124.15 billion SHIB withdrawn

In total, investors removed approximately 494.77 billion SHIB tokens from exchanges between June 25 and June 28. Although today’s figures remain incomplete, CryptoQuant data already shows an additional net outflow of 3.3 billion SHIB from exchanges. 

Shiba Inu Netflow
Shiba Inu Netflow

Exchange Reserves Decline as Accumulation Intensifies

As investors continue pulling tokens from trading platforms, Shiba Inu’s exchange reserves have started to decline from recent highs.

According to CryptoQuant data, SHIB exchange reserves currently stand at 80.05 trillion tokens. For comparison, reserves climbed to 80.55 trillion on June 24 after more than 700 billion SHIB flowed onto exchanges.

However, the recent wave of accumulation has reversed part of that increase. As a result, exchange reserves have fallen by approximately 0.62% from the June 24 peak. 

SHIB Exchange Reserve

SHIB Continues to Trade Sideways

Meanwhile, Shiba Inu’s price action has remained largely unchanged despite the significant exchange outflows recorded in recent days. The token has traded sideways for several sessions and currently changes hands at around $0.000004144, giving it a market capitalization of approximately $2.44 billion.

Over the weekend, Shiba Inu also lost its position among the world’s top 30 cryptocurrencies by market cap after Tether Gold (XAUT) overtook the meme coin in the rankings.

Additionally, several indicators that could support a price recovery remain weak. Monthly token burns total less than 200 million SHIB, a negligible figure compared to the token’s massive circulating supply of 589 trillion. At the same time, several ecosystem initiatives remain unfinished, while the community enthusiasm that fueled previous rallies has slowed significantly.

Furthermore, derivatives trading continues to dominate market activity. Futures volume currently accounts for approximately 83% of Shiba Inu’s daily trading volume of $61.4 million, highlighting the market’s dependence on short-term speculation rather than sustained spot demand. 

“RIP ADA Holders” as Cardano Falls Below $0.15, Reviving Altcoin Boom-and-Bust Concerns

Cardano (ADA) has come under scrutiny as its price continues to fall, dropping below the $0.15 mark.

The decline has drawn criticism from market commentators, who argue that the token has become another example of the boom-and-bust cycles that have affected many altcoins since the 2021 bull market.

Cardano Drops to Multi-Year Lows

Bitcoin author Duo Nine shared a long-term monthly ADA chart on X showing Cardano falling from its 2021 peak above $3 to around $0.14 in late June 2026.

The post carried the caption: “This is the Cardano chart. Now under 15 cents. RIP holders.”

The chart highlighted a familiar pattern. Massive price rallies during the bull market were followed by extended declines, while rebounds in 2024 and 2025 failed to produce a lasting recovery.

ADA currently trades at $0.1439. It is down 40% over the past month and 74% over the past year. The token has now fallen about 95.36% from its 2021 all-time high of roughly $3.10.

Image

The decline has also hurt Cardano’s position in the crypto rankings. ADA was once among the top 10 cryptocurrencies by market capitalization and remained there until just a few months ago. It has now fallen to 18th place.

Many Altcoins Follow the Same Pattern

Analyst Ted Pillows also weighed in, sharing a video comparing the monthly and weekly charts of Cardano, Polygon, Decentraland, The Sandbox, Gala, and Filecoin. The caption simply asked:

“Did we learn our lesson?”

The charts showed a similar pattern across many former market favorites. Prices surged during the last bull market before entering steep, multi-year declines.

Ted Pillows suggested that this recurring cycle highlights the risks of chasing speculative altcoins during periods of market euphoria. He contrasted their long-term performance with relatively stronger assets such as Bitcoin.

Former Market Leaders Remain More Than 95% Below Their Peaks

Polygon (MATIC), once considered one of Ethereum’s leading scaling solutions, now trades around $0.07166. It is down 22% over the past month and 60% over the past year. The token also remains about 95% below its 2021 all-time high of roughly $1.29.

The metaverse sector has performed even worse.

Decentraland (MANA) trades near $0.06369. It has lost 26% over the past month and 75% over the past year. The token is now about 99% below its 2021 peak of nearly $5.90.

MANA Chart CoinMarketCap

The Sandbox (SAND) has fallen 33% over the past month and 81% over the past year. It now trades roughly 99.45% below its all-time high of $8.44.

Gaming token Gala (GALA) has also extended its long decline. At $0.002273, it is down 27% over the past month and 84% over the past year. The token now sits about 99.73% below its record high of $0.8367.

Meanwhile, Filecoin (FIL) trades around $0.7168. It has dropped 27% over the past month and 69% over the past year. FIL remains roughly 99.7% below its all-time high of about $237.

Overall, the altcoins that dominated the 2021 bull market appear to have permanently lost much of their momentum.

Bitcoin Holds Up Better Than Most Altcoins

Bitcoin has not escaped the market downturn. It currently trades around $59,823, down 18.5% over the past month and 45% over the past year. It also remains about 52.63% below its all-time high of $126,198, reached last year.

Even so, Bitcoin has significantly outperformed many former leading altcoins, most of which remain down between 95% and 99% from their peaks.

BINANCE:BTCUSD Chart Image by Karimous_

That contrast has reinforced the view among many in the crypto community that Bitcoin is the only worthwhile long-term investment, while most altcoins ultimately trend toward zero.

XRP Sharpe Ratio Shows Traders Now Seeing Lower Returns Relative to Risk

0

The XRP Sharpe Ratio indicators confirm that market participants are now seeing lower compensation for the amount of risk they take.

XRP’s ongoing price decline has pushed its losses for the year to 43%. While the falling price has already weakened market sentiment, new data points to another growing concern. 

Specifically, XRP’s risk-adjusted performance has dropped considerably, suggesting that traders are no longer getting enough returns for the level of risk they are taking.

What the Sharpe Indicators Say About XRP

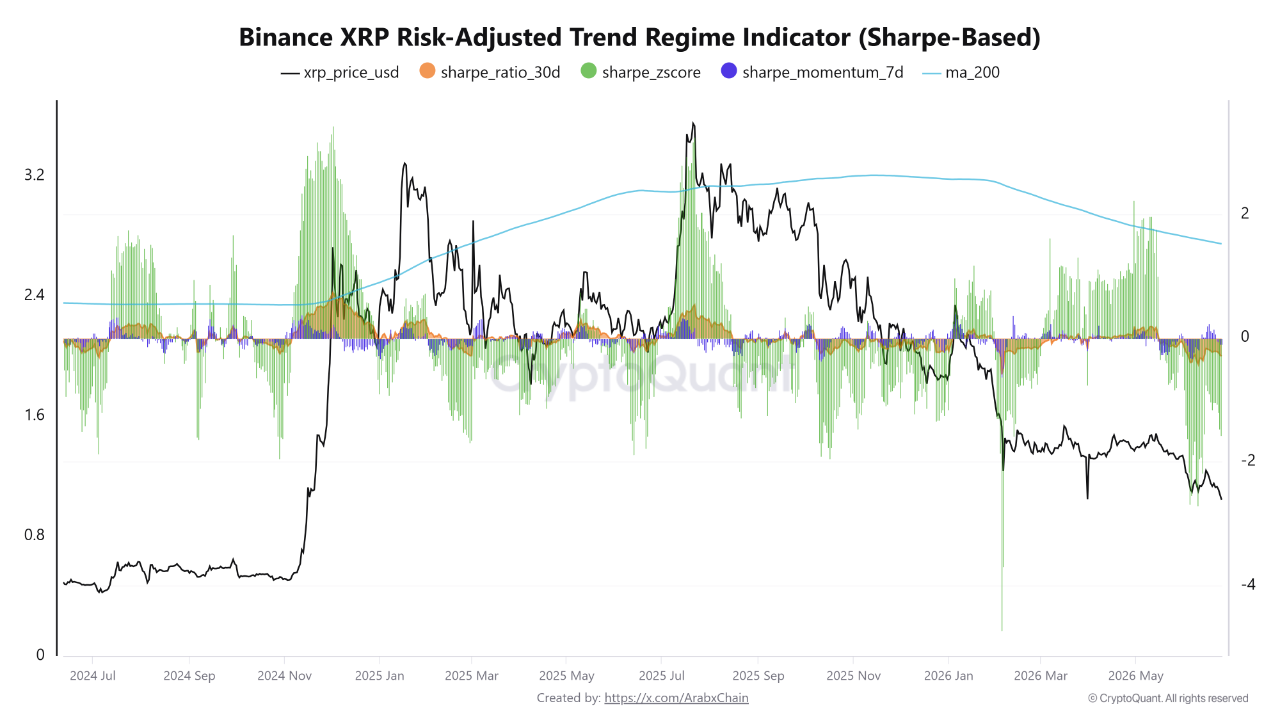
The latest figures show that the 30-day Sharpe Ratio has fallen to -0.29, while the Sharpe Z-Score has dropped to about -1.57. Also, the 7-day Sharpe Momentum stands at roughly -0.09. 

These figures indicate that XRP’s recent returns have become weaker compared to the amount of price volatility traders have faced over the past few weeks.

For context, the Sharpe Ratio measures how much return an asset generates for every unit of risk. A higher reading means the asset produces better returns relative to its volatility, while a lower reading shows that investors take on more risk without receiving enough return in exchange.

XRP Sharpe-Based Risk-Adjusted Trend CryptoQuant
XRP Sharpe-Based Risk-Adjusted Trend | CryptoQuant

The current readings suggest XRP remains in a weak position. Specifically, the 30-day Sharpe Ratio of -0.29 shows that the asset’s performance over the past month has not been strong enough to justify the amount of price swings investors experienced. 

Meanwhile, the Sharpe Z-Score at -1.57 indicates that XRP’s current performance is much weaker than its historical average. In addition, the negative 7-day Sharpe Momentum shows that short-term momentum continues to weaken. 

This suggests that recent recovery attempts have not been strong enough to change the broader trend or improve XRP’s risk-adjusted returns. 

XRP Holds Above $1.04 as Bulls Face Major Resistance

Besides the weak Sharpe readings, XRP’s daily chart suggests the asset has found new support around the $1.04 level. After losing the $1.30 price area, which served as XRP’s final line of defense from February to May 2026, the token turned that former support into resistance when it broke below it in June 2026.

XRP later tried to recover the $1.30 level, but sellers rejected the attempt on June 15, causing another decline that pushed the price down to $1.04. XRP now trades at $1.04293, with this level acting as its latest support. 

If the asset falls below $1.04, the next support sits around $1.0065, which matches the lower Bollinger Band on the daily chart. A break below that level would bring the sub-$1 range into focus for the first time since November 2024, increasing the chances of a decline toward $0.93 and then $0.87.

XRP Support Area and DMI

For XRP to recover from the latest sell-off, buyers must first push the price back above the middle Bollinger Band near $1.12. They would then need to reclaim the upper Bollinger Band around $1.23. 

Clearing those levels could allow XRP to challenge the important $1.30 resistance again. If buyers successfully reclaim that area, the next upside target could be $1.55.

DMI Shows Bears Still Have the Upper Hand

Meanwhile, the Directional Moving Index (DMI) also shows continued weakness in XRP’s market structure. Specifically, the negative directional indicator (-DI) has climbed to 30 and continues to move higher. 

At the same time, the Average Directional Index (ADX) has reached 28 and continues to trend upward. In contrast, the positive directional indicator (+DI) has dropped to 15.2 and continues to move lower.

These readings show that sellers still control the market, while buyers have yet to build enough strength to change the trend. Unless these indicators begin to improve, XRP could remain under pressure and face the risk of further price declines in the near term.

A $10,000 Investment in Shiba Inu at Its 2021 Peak Would Now Be Worth Less Than $500

0

A $10,000 investment in Shiba Inu at its 2021 all-time high would be worth less than $500 in today’s market, as its price has underperformed over the years.

Shiba Inu (SHIB) remains one of the most prominent meme coins in crypto, occupying the second spot by market cap in the meme sector. Yet, it has underperformed for a prolonged period of time.

At its current price of $0.00000416, Shiba Inu has dropped 90.8% from this bull cycle peak of $0.0000456 in March 2024. Even from its December 2024 high of $0.00003345, SHIB has corrected 87.5%.

Shiba Inu: The Journey from Its 2021 ATH

Meanwhile, its journey since the 2021 bull market has been a reminder of how quickly sentiment and market momentum can change. While many early buyers turned modest sums into life-changing wealth, those who entered near the top have experienced a very different outcome.

The token reached its all-time high of $0.00008854 in October 2021 as enthusiasm around meme coins reached extraordinary levels. Then, its market cap surged to a high of $54.22 billion, a figure many deemed unattainable for what started as an internet joke.

Since then, however, SHIB has spent years trading well below that record, leaving many holders wondering whether another major recovery is still possible. A look at the numbers shows just how dramatic that reversal has been.

A $10,000 Purchase at the Peak Looks Very Different Today

Specifically, someone who invested $10,000 when SHIB reached its record price of $0.00008854 would have received approximately 112.94 million SHIB.

At the current price of $0.00000416, that same holding would now be worth only about $469. That represents a decline of more than 95% from the original purchase value.

The example illustrates one of the defining characteristics of meme coins. Tokens capable of delivering extraordinary rallies can also experience equally severe declines once market momentum fades. 

Notably, this is not just tied to Shiba Inu. Other altcoins have also corrected over 90% from their 2021 peaks. This suggests that while meme coins have struggled, the capitulation in value is a broader altcoin market issue.

For many SHIB holders, the focus now turns to the possibility of the token recovering from the ongoing price dip.

Can Shiba Inu Still Recover?

Despite the steep decline, many analysts and members of the Shiba Inu community believe the project has not reached the end of its story.

For instance, analyst MMBTrader argued that Shiba Inu would soon “wake up and pump hard.” The outlook hinges on a prolonged boring accumulation and a potential descending channel breakout targeting $0.0000202. The rally would mark a 385% recovery from the current price, reaching price levels last seen in January 2025.

Interestingly, analysts are even predicting a recovery to a value near its current all-time high. Celal Kucuker projected that Shiba Inu could rally more than tenfold to $0.000070, a 1,582% growth from the current price.

However, some others remain cautious. James Wynn recently called Shiba Inu dead and boring, claiming that the token would never recover. His most notable reason is that SHIB has become old and outdated.

Another reason behind the pessimism is the enormous circulating supply. This means that meaningful price appreciation would likely require sustained demand. That, alongside continued token burns and expanding ecosystem activity, is a key requirement.

What Would It Take to Break Even?

For someone who bought at the October 2021 peak, returning to the original $10,000 value would require SHIB to revisit its previous all-time high near $0.00008854.

That is a substantial move from today’s price and would depend on several factors aligning, including stronger overall crypto market conditions, renewed interest in meme coins, continued ecosystem development, and sustained demand.

History shows that Shiba Inu has delivered surprising recoveries before. For one, the meme coin rallied from $0.00000878 in June 2023 to $0.0000456 in March 2024, representing a 420% increase. However, this does not guarantee that SHIB will recover this time.

For one who bought at $0.00008854 to break even, prices must reclaim this level. From the current market price, this requires a 2,028% rise.

Shiba Inu Falls Out of Global Top 30 Cryptocurrencies as SHIB Dips 40% YTD

0

Popular meme cryptocurrency Shiba Inu has officially dropped out of the world’s top 30 cryptocurrencies after months of sustained decline.

The latest week-long downturn has finally impacted Shiba Inu’s standing in the global crypto rankings. As a result, the token slipped to the 31st position, losing its long-held place among the top 30 digital assets by market capitalization.

Shiba Inu Falls Out of Top 30 Crypto 

According to data from CoinMarketCap, Shiba Inu is now the 31st-largest cryptocurrency globally. Over the past seven days, the token has fallen by 11.22%, pushing its price down to $0.000004153 and reducing its market cap to approximately $2.44 billion.

As Shiba Inu continued to decline, Tether Gold (XAUT) overtook it to claim the 30th position in the global rankings. Currently, XAUT holds a market cap of $2.48 billion, allowing it to edge past Shiba Inu and secure its position among the top 30 cryptocurrencies. 

Shiba Inu Falls Out of Top 30

A Sharp Contrast to Shiba Inu’s Early Success

The development has surprised many investors, especially those who witnessed Shiba Inu’s meteoric rise during the 2021 bull market.

At its peak, Shiba Inu reached an all-time high of $0.00008845 and entered the top 10 cryptocurrencies on several occasions. A few years later, lead ambassador Shytoshi Kusama even expressed ambitions of pushing the token into the top five.

However, the project has since experienced a dramatic reversal. Shiba Inu now trades 95.3% below its all-time high and has declined by 39.84% since the start of the year.

Weak Market Structure Continues to Pressure SHIB

Meanwhile, Shiba Inu’s broader market structure remains weak, with trading activity indicating a thinning market.

According to CoinGlass data, spot trading volume currently stands at just $10.94 million, significantly below futures volume of $51.41 million. This imbalance suggests that speculative derivatives trading dominates genuine buying demand.

In addition, Shiba Inu’s open interest sits at $30.73 million, indicating moderate leverage exposure but limited conviction from long-term market participants. Although funding rates remain slightly positive at 0.0063%, signaling a mild bullish bias in perpetual futures markets, price action and capital inflows have failed to support that optimism.

Liquidation metrics further reinforce the market’s fragile condition. Over the past 24 hours, total liquidations reached $46,390. Long positions accounted for the majority of those losses at $43,090, while shorts represented just $3,300. The imbalance suggests that bullish traders have borne most of the market’s pain during the latest decline.

Shiba Inu Fundamentals Remain Weak 

Despite Shiba Inu’s fall below the top 30 and its deteriorating market structure, supporters continue to attribute the weakness to broader bearish market conditions.

Many believe the token could stage a significant recovery once overall market sentiment improves. However, Shiba Inu’s underlying fundamentals have offered little support for that bullish outlook in recent months.

Critics argue that the Shiba Inu ecosystem appears increasingly abandoned by its leadership team. They point to Shytoshi Kusama’s prolonged silence on social media and his focus on an independent AI initiative as evidence of shifting priorities.

Furthermore, several ecosystem projects that were originally introduced to drive adoption remain incomplete or inactive. These unfinished initiatives include Shib: The Metaverse, Shib Marketplace, and the Layer-3 blockchain Shib Alpha Layer.

Meanwhile, critics consider Shibarium effectively deserted due to its declining on-chain activity. For context, Shibarium currently processes only 787 daily transactions. Moreover, decentralized exchange volume across the network has remained at zero since June 23, while total value locked has dropped to just $170,699. 

Shibarium DeFi Activity

Token Burns Remain Too Small to Impact Supply

Shiba Inu’s enormous token supply also continues to weigh heavily on price performance. Although the project’s burn mechanism was designed to reduce circulating supply, burn activity has slowed considerably.

Over the past 24 hours, the community burned just 2.41 million SHIB worth approximately $10. During the last seven days, total burns reached only 19.13 million tokens, while monthly burns amounted to 108.40 million SHIB.

These figures remain negligible when compared to Shiba Inu’s massive circulating supply of approximately 589 trillion tokens.

Shiba Inu burns
Shiba Inu burns

Ecosystem Tokens Also Continue to Struggle

The weakness extends beyond SHIB itself, as other ecosystem tokens have also suffered substantial losses from their previous highs.

According to CoinMarketCap data, Bone ShibaSwap (BONE) has plunged 99.9% from its all-time high, while Doge Killer (LEASH) has effectively erased all of its gains, falling nearly 100% from its peak valuation. 

XRP Long Liquidations Surge 832% as Derivatives Market Undergoes Major Reset

XRP derivatives traders have gone through a major leverage reset in recent weeks.

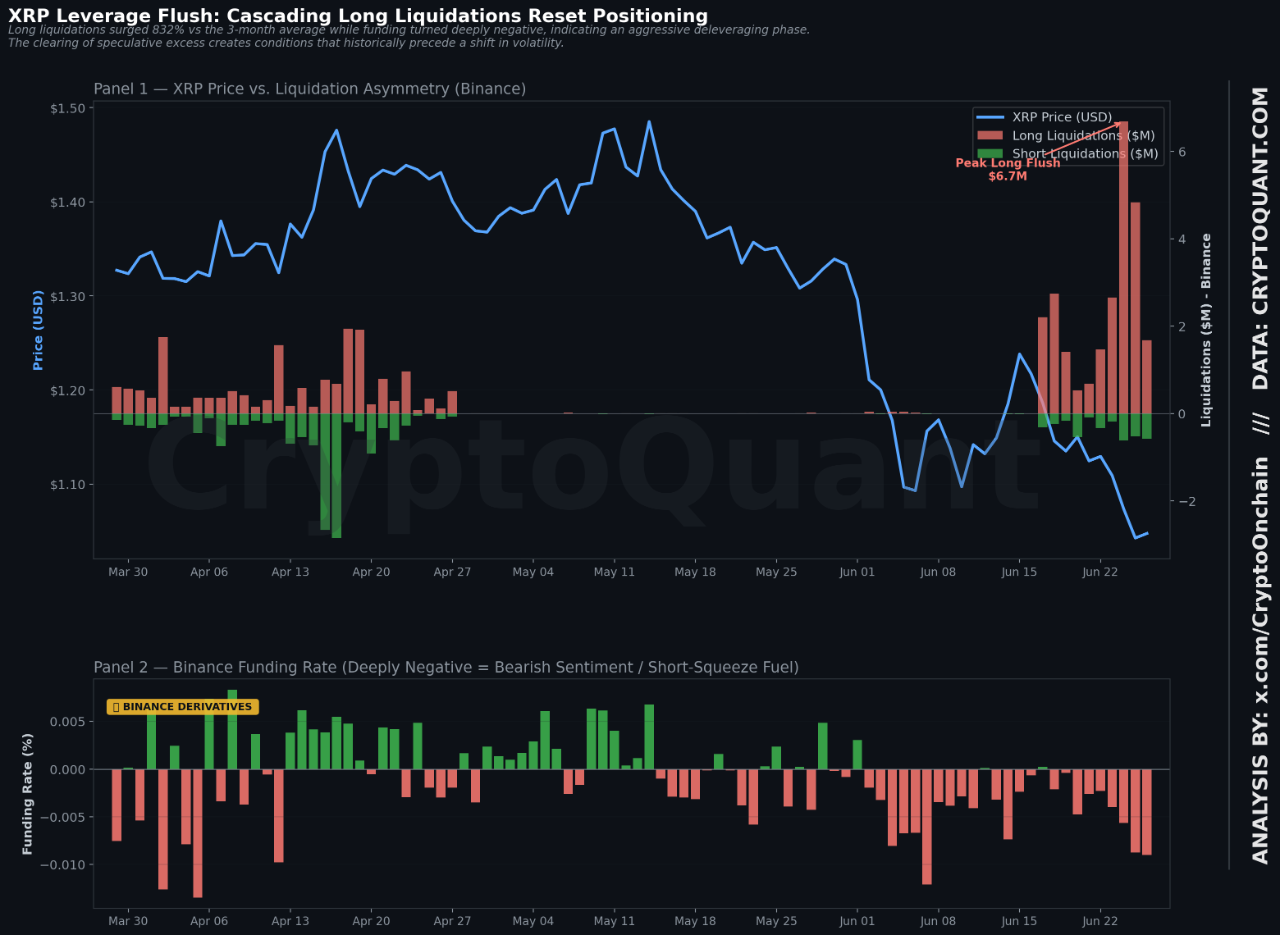
Notably, long liquidations have surged 832% above the three-month average, while falling open interest and negative funding rates point to aggressive deleveraging rather than broad selling by long-term holders.

In other words, leveraged traders betting on higher prices have been forced out in recent weeks. However, stable spot exchange reserves suggest many XRP holders are choosing to ride out the volatility instead of selling.

For context, XRP’s price has dropped by more than 20% over the past three months. On a yearly basis, XRP is down 53%.

XRP Derivatives Undergo Major Reset

CryptoQuant data shows XRP experienced a sharp wave of long liquidations over the past month. Nearly $3 million in leveraged long positions were wiped out during the latest decline. One liquidation event alone erased about $6.7 million in long positions, highlighting the scale of the sell-off.

At the same time, XRP’s open interest dropped from roughly $1.18 billion to around $1.04 billion, an 11.1% decline over the month. Falling open interest alongside rising liquidations suggests traders are leaving the market rather than rotating into new positions.

Funding rates on Binance have also turned deeply negative. CryptoQuant said this represents a 463% shift from the quarterly baseline. Negative funding means short sellers are paying longs, showing bearish positioning has become dominant in perpetual futures markets.

Overall, the XRP derivatives market data points to widespread long liquidations, with long positions being liquidated far more heavily than short positions.

Spot Investors Stay Calm

Meanwhile, spot investors have remained resilient. CryptoQuant noted that Binance’s XRP spot reserves fell just 0.35% week over week. That suggests little XRP has moved onto exchanges for immediate selling. Instead, tokens have been withdrawn from exchanges.

Stable exchange reserves contrast sharply with the heavy futures liquidations. This suggests long-term holders have largely avoided panic selling despite XRP’s recent weakness.

This divergence between the derivatives and spot markets is healthier than a scenario in which leveraged traders and spot holders sell simultaneously.

Attention Turns to the Next Move

Historically, major volatility has often followed deeply negative funding rates combined with exhausted long liquidations. Once excessive leverage has been flushed out, the market is in a better position for its next move. The focus now is on whether open interest begins to recover.

CryptoQuant also pointed to Ripple’s recent RLUSD expansion into Japan through SBI VC Trade as a positive long-term development. However, it said near-term price action will continue to be driven primarily by derivatives activity.