Home Blog Page 828

Bhutan Government Shifts Fresh 419 Bitcoin Worth $36M to Unmarked Address: Another Round of Selloffs?

0

An address identified as belonging to Druk Holdings, the commercial arm of the Bhutan government, has shifted Bitcoin to an unmarked wallet.

Data from Arkham confirmed this shift, which happened at 10:51 (UTC) on April 2, a day Donald Trump themed as America’s Liberation Day. On-chain analysis shows that two addresses belonging to the Bhutan government shifted 419.5 BTC, worth $35.65 million, to an unidentified address.

Bhutan Moves Fresh Bitcoin

While crypto investors focus on the market’s price action today, the Bhutan government is shuffling its tokens. The entity moved 377.8 BTC ($32.11 million) from its main Bitcoin holding wallet to a new address, “bc1qn6.”

Meanwhile, Arkham shows that another wallet identified as belonging to the country also sent Bitcoin to the receiving address. The wallet, “34oXLr,” transferred 41.7 BTC ($3.5 million) alongside the 377.8 BTC ($32.11 million), totaling 419.5 BTC ($35.65 million).

While the funds remain in the new wallet at the time of writing, Bhutan’s history of selling Bitcoin has raised concerns among market participants about another dump. Notably, the government shifted 1,664 BTC ($144.57 million) to several addresses last week.

While Bhutan has continued to sell off its Bitcoin for profit, the United States is looking to halt all sales of their balance and even increase it. Notably, President Donald Trump signed an executive order last month to create a strategic Bitcoin reserve for the country. Meanwhile, senator Cynthia Lummis has introduced the BITCOIN Act, looking to procure 1 million BTC for the country.

Meanwhile, despite its recent sales, the Royal Government of Bhutan still holds 8,594 BTC, worth over $729 million. Statistically, it ranks fourth among the largest countries holding the pioneering cryptocurrency, just above El Salvador.

The Bhudi-dominated landlocked nation is a key player in the crypto space, harnessing its rich hydroelectric resources to mine Bitcoin. Its cryptocurrency holdings account for 30.7% of its gross domestic product (GDP), valued at about $2.9 billion in 2023.

Bitcoin Reclaims $86,000 Regardless

Despite uncertainties from the Bhutan shift and the impact of Trump’s tariff implementation, Bitcoin has reclaimed $86,000. The asset rebounded 2.5% from a low of $83,914 today to hit $86,149 before retracing slightly.

If momentum persists, Bitcoin could be on course for its third consecutive positive daily close for the first time since early January. The crypto firstborn trades at $85,566, up nearly 1% in the past 24 hours.


Alabama Seeks to Establish Bitcoin Reserve Using 10% of State’s Funds 

0

Alabama lawmakers have introduced a bill that requires the State Treasurer to invest up to 10% of the state’s funds in Bitcoin. 

The bill, dubbed House Bill 482, provides a comprehensive framework that requires the State Treasurer to invest up to 10% of Alabama’s funds in Bitcoin. Although the bill did not explicitly mention Bitcoin, it only permits investments in digital assets with an average market cap of $750 billion over the past 12 months. 

Currently, only Bitcoin meets this requirement. The premier asset has maintained a market cap of over $1 trillion within this timeframe. 

Custody Requirements 

Notably, the bill mandates the state’s treasurer to store the digital assets using a secure custody solution, which prevents smartphone access, utilizes encrypted channels, and grants the government exclusive control. 

It also requires that the custody solution support multi-party governance, transaction logging, and regular security audits. Alternatively, the bill proposes that the assets be held through a qualified custodian. 

In addition, the bill permits the State Treasurer to loan the digital assets to generate more returns. However, this will only be permitted so long as the loaning of assets does not increase the overall financial risks. 

Potential Date of Implementation 

Once the state senate approves the bill, it will become effective on October 1, 2025, exactly six months from now. The scheduled date is expected to give the state’s financial authorities substantial time to prepare for the potential digital asset investments. 

Meanwhile, the new bill was introduced in the Alabama State House of Representatives during the 2025 regular session. A bipartisan group of lawmakers from the Republican and Democratic Parties backed the bill, including Alabama State Representatives Mike Shaw, Parker Moore, Chip Brown, and Margie Wilcox. 

It has already been assigned to the Budget and Finance Committee for review before the full House vote. 

In the meantime, several U.S. states have been considering investing a portion of their funds in Bitcoin. States like Texas and New Hampshire have already progressed with their Bitcoin reserve bills. 

As reported earlier, the Texas Senate passed the bill last month, which requires the state to invest a portion of its funds in Bitcoin. The bill is currently awaiting gubernatorial approval. 

Grayscale Launches New Bitcoin ETFs Targeting Yield Seekers

Leading crypto asset manager Grayscale Investments has launched two new Bitcoin-focused exchange-traded funds (ETFs), expanding its product offerings.

The new ETFs include the Grayscale Bitcoin Premium Income ETF (BPI), and the Grayscale Bitcoin Covered Call ETF (BTCC). According to the asset manager, these ETFs introduce covered call writing strategies to help investors generate income while gaining exposure to Bitcoin’s volatility.

Bitcoin Exposure with an Income-Generating Twist

The newly introduced ETFs cater to investors looking for income-first strategies in the volatile Bitcoin market. Unlike traditional Bitcoin ETFs that primarily track the asset’s price movement, BTCC and BPI incorporate cover call strategies, which involve selling options contracts to generate premiums.

BTCC: Income-Focused

The Grayscale BTCC ETF is an income-prioritization strategy. It achieves this by systematically selling call options close to Bitcoin’s spot price, generating regular option premiums for investors.

While this approach provides a steady income stream, it caps the fund’s upside potential since gains are limited when Bitcoin surges above the call option’s strike price.

According to Grayscale, this strategy could appeal to investors seeking consistent cash flows and a defensive approach to Bitcoin exposure by potentially reducing volatility during market drawdowns.

BPI: Balance Between Income and Upside

On the other hand, the Grayscale BPI ETF presents an alternative to investors who want exposure to Bitcoin’s price appreciation while still benefiting from some income generation. 

BPI achieves this by writing call options well out-of-the-money, meaning investors can participate in more of Bitcoin’s potential upside and still collect premiums.

Grayscale believes BPI may attract investors who are bullish on Bitcoin but also want an additional layer of yield.

Grayscale Expanding Bitcoin Offering 

With the introduction of BTCC and BPI, Grayscale is diversifying its ETF offerings beyond its flagship Grayscale Bitcoin Trust (GBTC). The new funds provide alternative ways for investors to engage with Bitcoin by maximizing income.

David LaValle, the Global Head of ETFs at Grayscale, emphasized that the launch of these two funds was driven by the need to address diverse investor objectives.

Earlier this week, Grayscale sought the SEC’s permission to convert its Digital Large Cap Fund, which holds Bitcoin, into an ETF. Per the filing, the ETF will list on NYSE, expanding access to its beyond accredited investors.

New Shiba Inu Lows? Analyst Predicts Further Correction After Fakeout

0

Shiba Inu may see further downsides as an analyst identifies a fake price breakout following a recent rejection from a crucial resistance level.

After a strong start last week, enthusiasts were looking to relive the Shiba Inu parabolic expansion dream. The meme coin rallied 4.48% on Monday, and before Wednesday, it had reached the late February high of $0.00001567.

However, the asset quickly lost momentum around the price mark, crashing alongside the broader market. Shiba Inu has retraced 21% from the high, with a prominent market watcher suggesting further downsides.

Analyst Explains Recent Downside

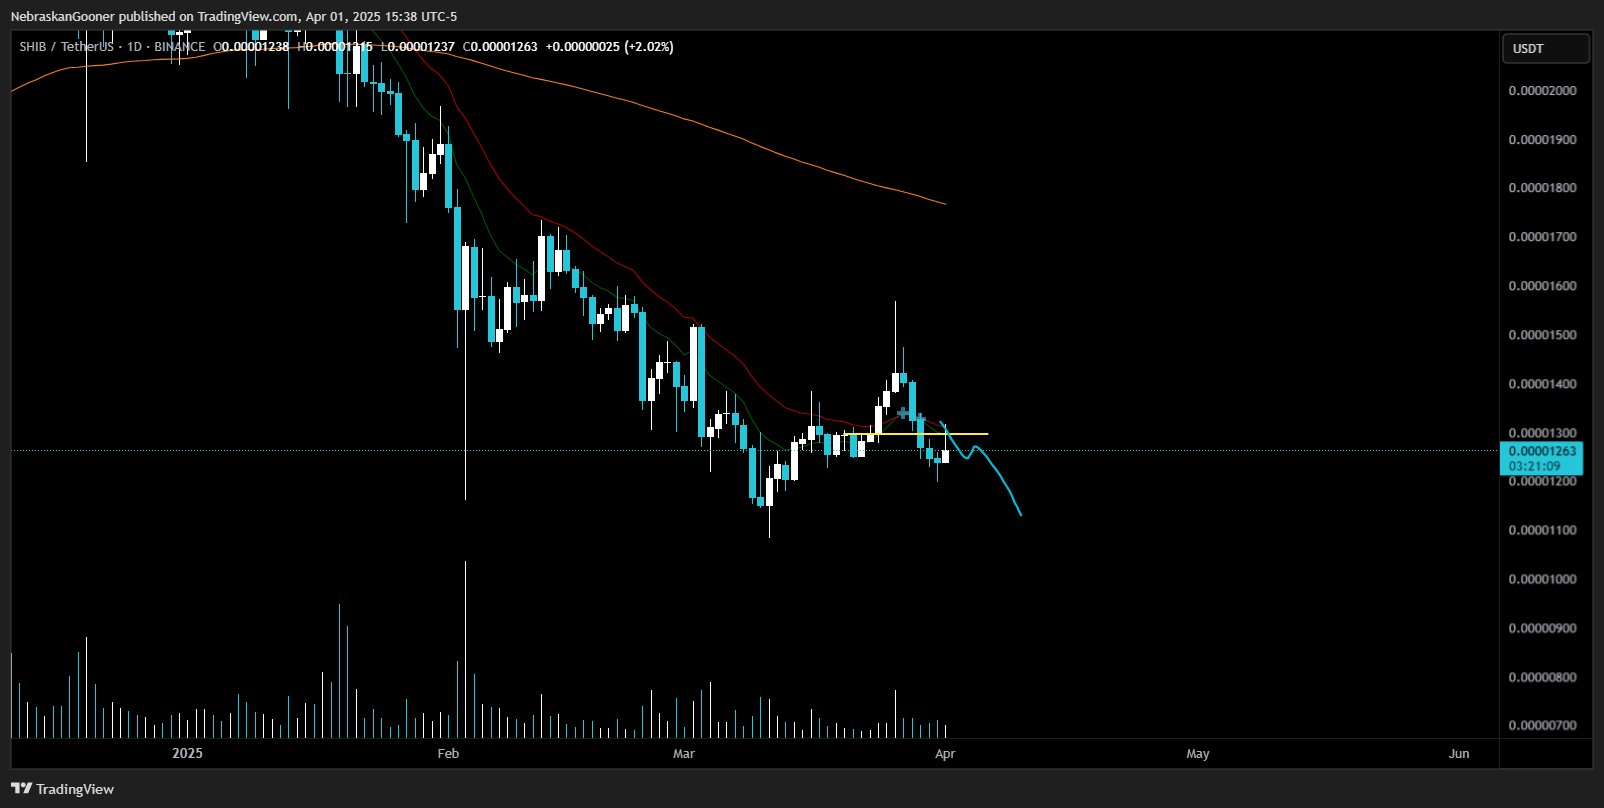
In an X commentary on April 1, analyst Nebraskangooner identified the catalyst for this sudden crash. Aside from the broader macro bearishness of Donald Trump’s proposed tariff hikes, he highlighted that Shiba Inu faced intense opposition from a resistance level a week ago.

The $0.00001567 price zone acted as a buffer against lower prices in early February, but Shiba Inu desecrated the stronghold on February 24, turning the zone into a resistance level. Unfortunately, the meme coin’s upside momentum could not ensure safe passage through the supply zone, with adverse broader market conditions contributing to the weakness.

Meanwhile, Nebraskangooner also identified a fake breakout from a macro resistance yesterday after SHIB jumped nearly 3% to an intraday high of $0.00001315. Following the rejection, the prominent memecoin has forayed downwards, retracing 6% from the price mark.

Interestingly, the market watcher identified a similar trend among other altcoins, predicting that further corrections are on the horizon. Although he did not explicitly mention a specific target for the downside, an accompanying chart suggests a retest of the March 11 low of $0.00001082, nearly 13% away from the current market price.

Shiba Inu Fakeout/Nebraskangooner

Bearish Momentum at Its Peak?

Meanwhile, Shiba Inu enthusiast and Pawzone founder JD Hatefi has insisted that the downsides of the doggy-themed, lighthearted meme coin will soon be over. In a tweet, he noted that the crypto market will soon be emancipated from the shackles of Trump’s “Liberation Day” and resume an uptrend.

He predicted a Bitcoin target of $150,000, which he believes will spur a broader market rebound. Specifically, he stated that Shiba Inu will go parabolic when the tariff troubles cease, possibly to unprecedented pries.

In the meantime, SHIB trades at $0.00001024, down 2.36% in the past 24 hours.
Binance BNB Struggles at $600: Will Bears Push Below $580?

Binance Coin (BNB) is hovering near the $600 mark as bearish technical indicators suggest a potential dip below $580.

As the crypto market struggles to mount a bullish comeback, Binance Coin is fluctuating close to the psychological $600 level. The BNB token currently trades at $603, with an intraday pullback of 1.31%.

This undermines the recently formed bullish pattern and signals the possibility of a deeper fall below the $600 mark. Will this downturn lead to a breakdown of the $580 support level?

Binance Coin Price Analysis

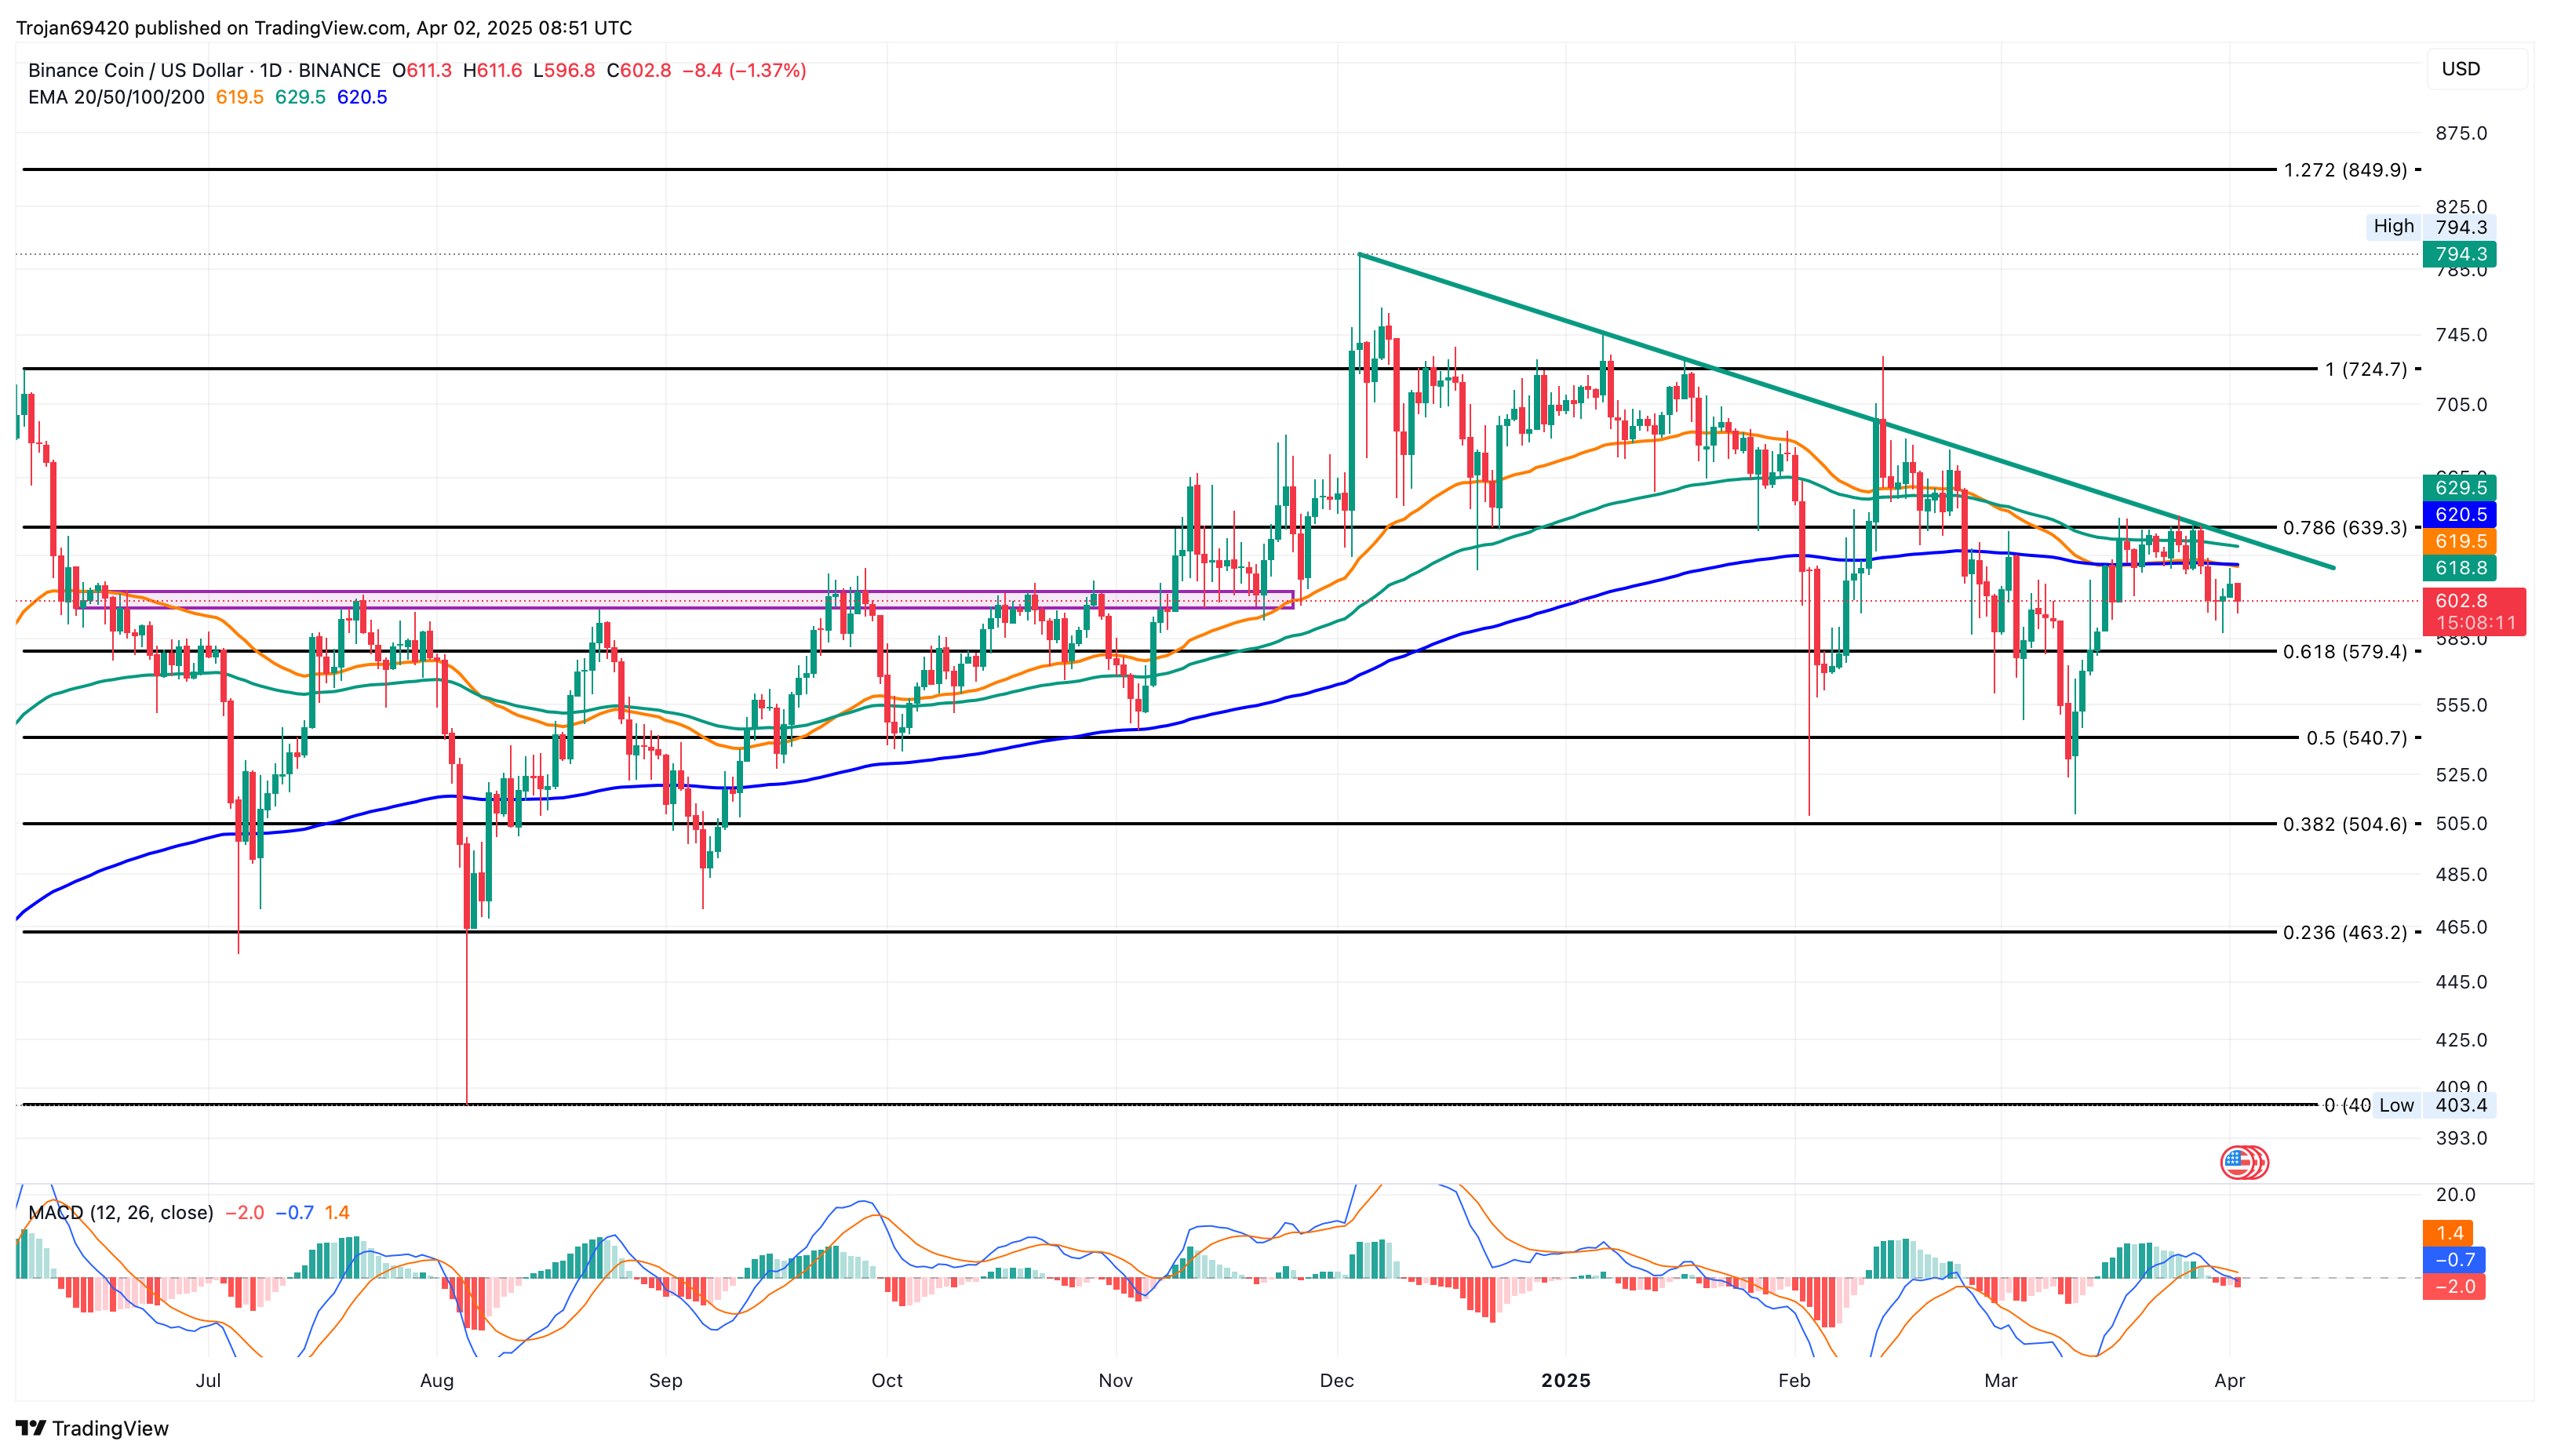
On the daily chart, Binance Coin’s price action shows a long-standing resistance trendline that has kept bullish growth in check. This has led to multiple failed bullish attempts since the start of 2025.

The bearish reversals from the overhead trendline resulted in downswings to $560 and even near the $500 psychological level. The recent downturn from the resistance trendline has breached the 200-day EMA line and struggles to stay above the $600 mark.

Binance Coin Price Chart

With multiple lower-price rejections, the BNB coin shows early signs of a reversal near the 61.80% Fibonacci level, around $580. However, the intraday pullback and the post-retest downturn from the 200-day EMA suggest a potential steeper correction.

Additionally, the 50-day and 200-day EMA lines have formed a “death cross,” coupled with a negative crossover in the MACD and signal lines. These technical indicators warn of a breakdown below the $580 support level.

BNB Coin Futures Witness A Surge in Long Positions

As volatility increases in BNB Coin’s price trend, the derivatives market has witnessed a slight decline. According to data from Coinglass, BNB’s open interest has dropped by 1.19% to $796.60 million, while the funding rate remains at 0.0030%.

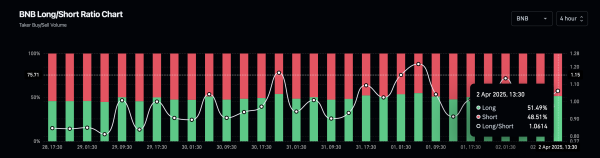
The BNB long-to-short ratio chart shows a surge in long positions. Over the past 12 hours, long positions have increased, driving the long-to-short ratio to 1.0614. With a positive funding rate and the rising number of long positions, bullish sentiment is gradually strengthening.

Binance Long/Short Ratio Chart

VanEck Files for BNB Coin ETF

Supporting the chances of an extended recovery in Binance Coin, VanEck has filed for a BNB ETF.

While the announcement had minimal effect on Binance Coin’s price, which continues to fluctuate around $600, approval could drive fresh capital inflows, potentially pushing BNB price higher.

BNB Price Targets

Based on the current price analysis, the 61.80% Fibonacci level near $580 remains the immediate crucial support level for BNB. The lower price rejections indicate that Binance Coin could hold above the $600 mark.

However, the prevailing downward pressure reflects increased bearish influence, warning of a potential breakdown. If that occurs, the 50% Fibonacci level at $540 will be the next price target for buyers.

Optimistically, if a reversal and broader market recovery occur, BNB could break the overhead resistance trendline. In this scenario, BNB could surpass the 78.60% level near $640 and potentially reach the next resistance at $724.

Here’s How You Could Have Made Over $7B with $5K Shiba Inu Investment

0

Early Shiba Inu investors would have made a massive profit of more than $7 billion if they had invested a minimum of $5,000 in SHIB. 

As top crypto assets like Shiba Inu continue to witness huge downturns, many investors–especially those who entered the market after the 2021 bull market–are wondering what their fate might have been if they had benefited from SHIB’s historic surge. 

Stories about Shiba Inu’s historic surge in the 2020/2021 market cycle have traveled far and wide across the financial world. Many investors have used the story to encourage newcomers to focus on long-term gains instead of short-term fluctuations. 

Shiba Inu Historic Gain 

Recall that Shiba Inu launched in August 2020, when the world was battling the effects of the coronavirus pandemic. It debuted on the Ethereum-based decentralized exchange Uniswap, with its price starting at $0.000000000056. 

Despite the heavy market fluctuations due to the pandemic, some investors took the risk and purchased SHIB. As time went by, SHIB started gaining traction, with more investors adopting the token. 

This attracted major exchanges like Binance to list the token in May 2021, driving its value to greater heights. Interestingly, Shiba Inu’s pseudonymous founder Ryoshi gifted Ethereum’s co-founder Vitalik Buterin half of SHIB’s supply–500 trillion tokens. 

On May 17, 2021, Buterin burned over 410 trillion SHIB by sending the tokens to a dead wallet while gifting the remainder to charities. 

The move contributed immensely to SHIB’s popularity, leading to its surge to an all-time high of $0.00008845 on October 28, 2021. This surge represents an increase of 157,946,328 (157.94 million percent) from SHIB’s initial price. 

How $5K Would Have Turned Into $7B

Investors who purchased SHIB at its initial price and sold when the token reached its ATH raked in jaw-dropping returns. For instance, people who invested $5,000 in Shiba Inu when the token launched and traded at an initial price of $0.000000000056 would have procured 89,285,714,285,714 (89.26 trillion) SHIB. 

Interestingly, the dollar value of this 89.26 trillion SHIB skyrocketed to $7.89 billion when Shiba Inu spiked to an ATH of $0.00008845 on October 28, 2021.

This represents a staggering 157,939X return on investment. Such an astronomical surge can give investors early retirement, regardless of their country of residence. Indeed, many crypto investors became millionaires and billionaires from SHIB with just a few thousand invested early.

Can Shiba Inu Replicate This Surge? 

While this remarkable surge is fascinating, it is important to note that the possibility of Shiba Inu replicating this growth is highly unlikely. To put this into perspective, a surge of 157,946,328% from the current price of $0.00001239 will take SHIB’s value to $19.56 per token. 

Shiba Inu will have a market cap of $11.52 quadrillion at this price, assuming SHIB’s circulating supply of 589.25 trillion tokens remains stable. 

Notably, there is not enough money in the world to drive SHIB to this valuation. Hence, SHIB may experience another jaw-dropping rally of over 157 million percent. 

Ethereum Struggles Below $1,900: Will It Dip to $1,500?

Ethereum faces rejection at a key resistance level as bearish pressure mounts, raising the risk of a correction to $1,533.

While Bitcoin gains momentum and hints at a potential breakout rally, Ethereum is struggling to break above the $1,900 mark. Despite a 4.56% jump last night, Ethereum faced resistance at the local trendline.

However, the bulls suffered another setback with an intraday pullback of 2.33%. Currently trading at $1,860, Ethereum shows signs of a potential correction. Could this lead to a drop to $1,500?

Ethereum Analysis: Warning of a Steeper Correction to $1,533

In the daily chart, Ethereum’s price trend continues to follow the pattern discussed in previous articles. Ethereum is testing the local resistance trendline within the channel pattern, which limits the likelihood of a bullish breakout.

With another failed bullish attempt, Ethereum is showing signs of a potential downswing from the secondary trendline. The 2.33% intraday pullback drops the market price to $1,860, slowly undermining the previous overnight recovery.

Ethereum Price Chart

As bearish pressure increases, Ethereum could fall to the recently formed support zone between $1,807 and $1,834. However, the stochastic RSI indicator suggests a minor possibility of a breakout rally, especially if the broader market enters a bullish recovery phase.

The positive crossover of the K and D lines in the stochastic RSI is preparing for a new positive cycle. This could lead to a breakout rally challenging the overhead resistance trendline within the falling channel pattern.

Based on pivot levels, an uptrend could push Ethereum above the center pivot, near the psychological $2,000 level. Optimistically, a channel breakout could see Ethereum test the R2 resistance level at $2,839.

On the other hand, a deeper correction below the $1,800 mark could likely test the S1 support level at $1,533.

Expert Predicts Stronger Altcoin Season Ahead

Despite Ethereum’s ongoing struggles, Joao Wedson, founder of Alphractal, is anticipating a new altcoin season. The analyst notes that while altcoin dominance has declined, excluding Ethereum and stablecoins, it has remained in a neutral zone since late 2022.

Joao suggests that Bitcoin has captured a significant portion of Ethereum’s market cap, as evidenced by the rising Bitcoin dominance, now at 62.5%. Meanwhile, Bitcoin and stablecoin dominance exceeds 70%. Conversely, Ethereum and other altcoins now hold close to 29%.

On the positive side, Joao believes that the next altcoin season could be even stronger as Bitcoin and stablecoin dominance increases. This assumption is based on the higher liquidity of stablecoins in the market and the stability driven by rising Bitcoin prices.

Ethereum ETFs Face Turbulent Waters

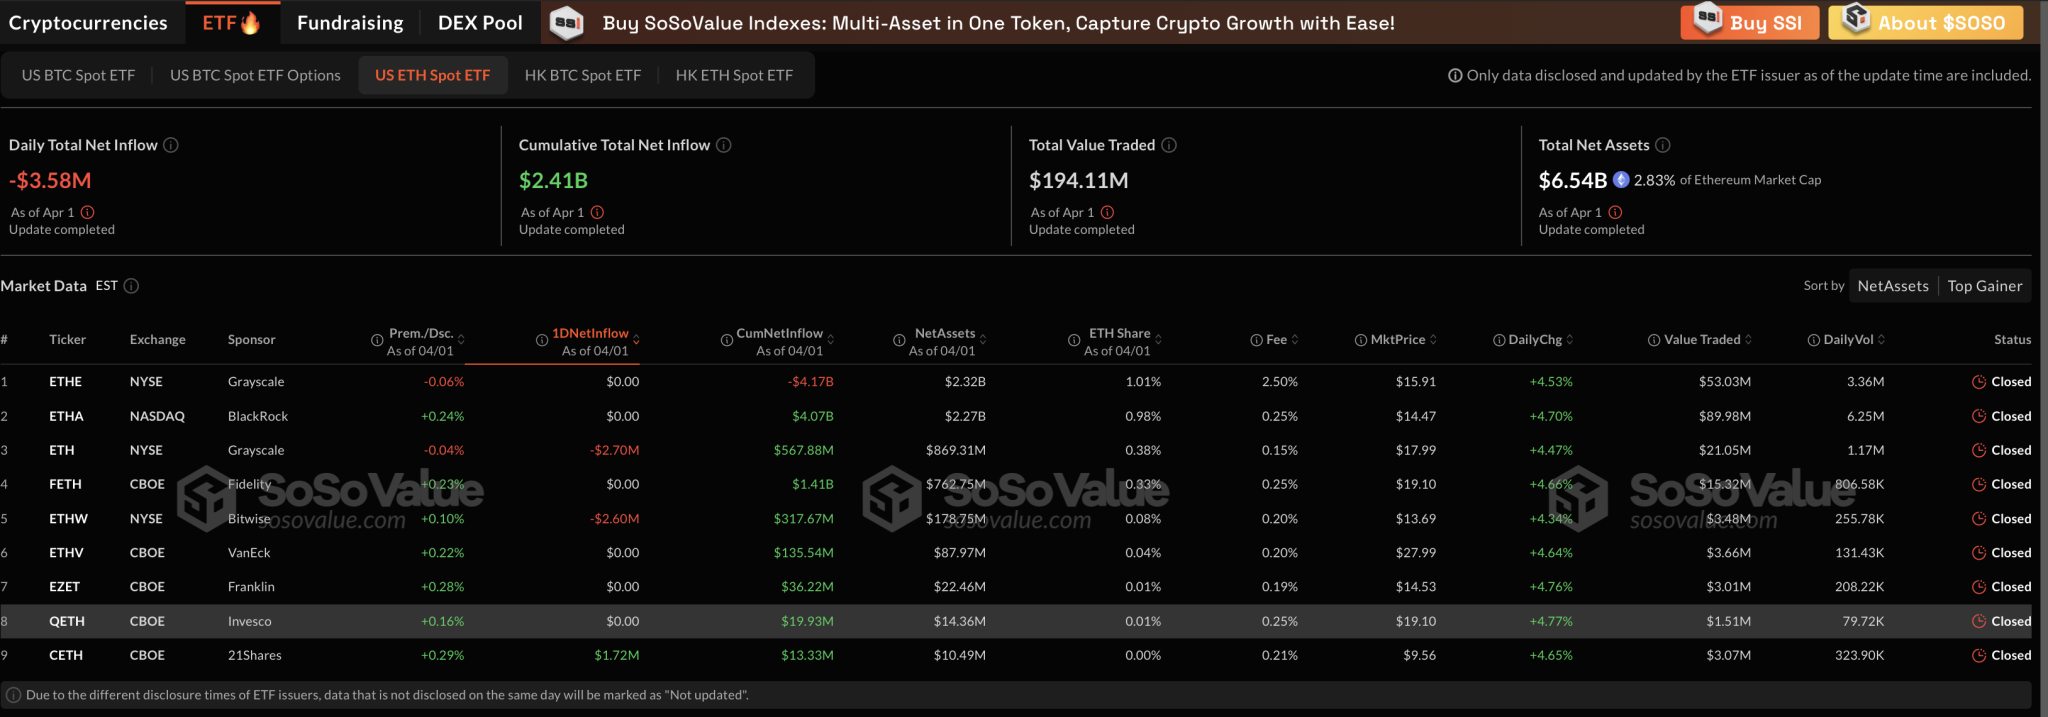
As of April 1, the daily total outflow from U.S. Ethereum Spot ETFs was $3.58 million. While 21Shares saw a net inflow of $1.72 million, Bitwise recorded an outflow of $2.60 million, and Grayscale saw an outflow of $2.70 million.

Ethereum ETFs
Ethereum ETFs

Other Ethereum ETFs maintained a net-zero outflow. Last week, Ethereum ETFs recorded a total net inflow of $2.84 million, ending a five-week streak of outflows.

As of April 1, the total net assets of U.S. Ethereum Spot ETFs stand at $6.54 billion, representing 2.83% of Ethereum’s market cap.

Bitcoin Battles Key Resistance Trendline: Is $92K Likely?

Bitcoin is nearing a key resistance breakout, fueling bullish anticipation for a potential surge to $92K. Could this lead to a new bullish rally toward $100K?

On Tuesday, Bitcoin briefly reached the $85,000 mark, registering a 3.19% price gain. Increased price volatility initially resulted in a 24-hour low of $81,188, but the market has rebounded nicely. Will this increased trend momentum lead to an impulsive breakout rally?

Bitcoin Price Analysis

In the daily chart, the Bitcoin pullback trend, which began in late January, has formed a local resistance trendline. The downturn reached a point where it saw a downswing to around the $76,000 mark, slightly above the 50% Fibonacci level at $75,533.

Bitcoin Price Chart
Bitcoin Price Chart

Now, Bitcoin’s recovery run is struggling to overcome the newly formed resistance trendline. On April 1, a Morning Star pattern was completed, with a bullish engulfing candle showing a 3.19% surge that tested the overhead resistance trendline.

Currently, Bitcoin is forming a lower price rejection bearish candle, reflecting a quick bullish turnaround from the 61.80% Fibonacci level at $81,855.

Despite this, strong underlying support suggests Bitcoin is close to surpassing the overhead trendline. Technical indicators point to a potential continuation of the uptrend.

However, the MACD and signal lines indicate a minor pullback in bullish momentum as the average lines have converged. Despite this, a resurgence in bullish histograms could reignite the positive trend.

Analysts Highlight Strong Resistances Amid Rising Supply

As Bitcoin prices hint at a potential breakout, crypto analyst Ali Martinez has pointed out two key resistance levels based on the MVRV Extreme Deviation Pricing Bands: $94,280 and $112,380.

However, the analyst also cautions about the growing Bitcoin exchange reserves. According to data from CryptoQuant, over 21,000 BTC have been moved to exchanges in the past four days.

This has increased Bitcoin exchange reserves from 2.419 million BTC to 2.440 million BTC. The rise in exchange supply amid growing volatility could lead to rapid downside spikes, as seen with the recent 24-hour low.

Bitcoin ETFs Signal New Outflow Cycle

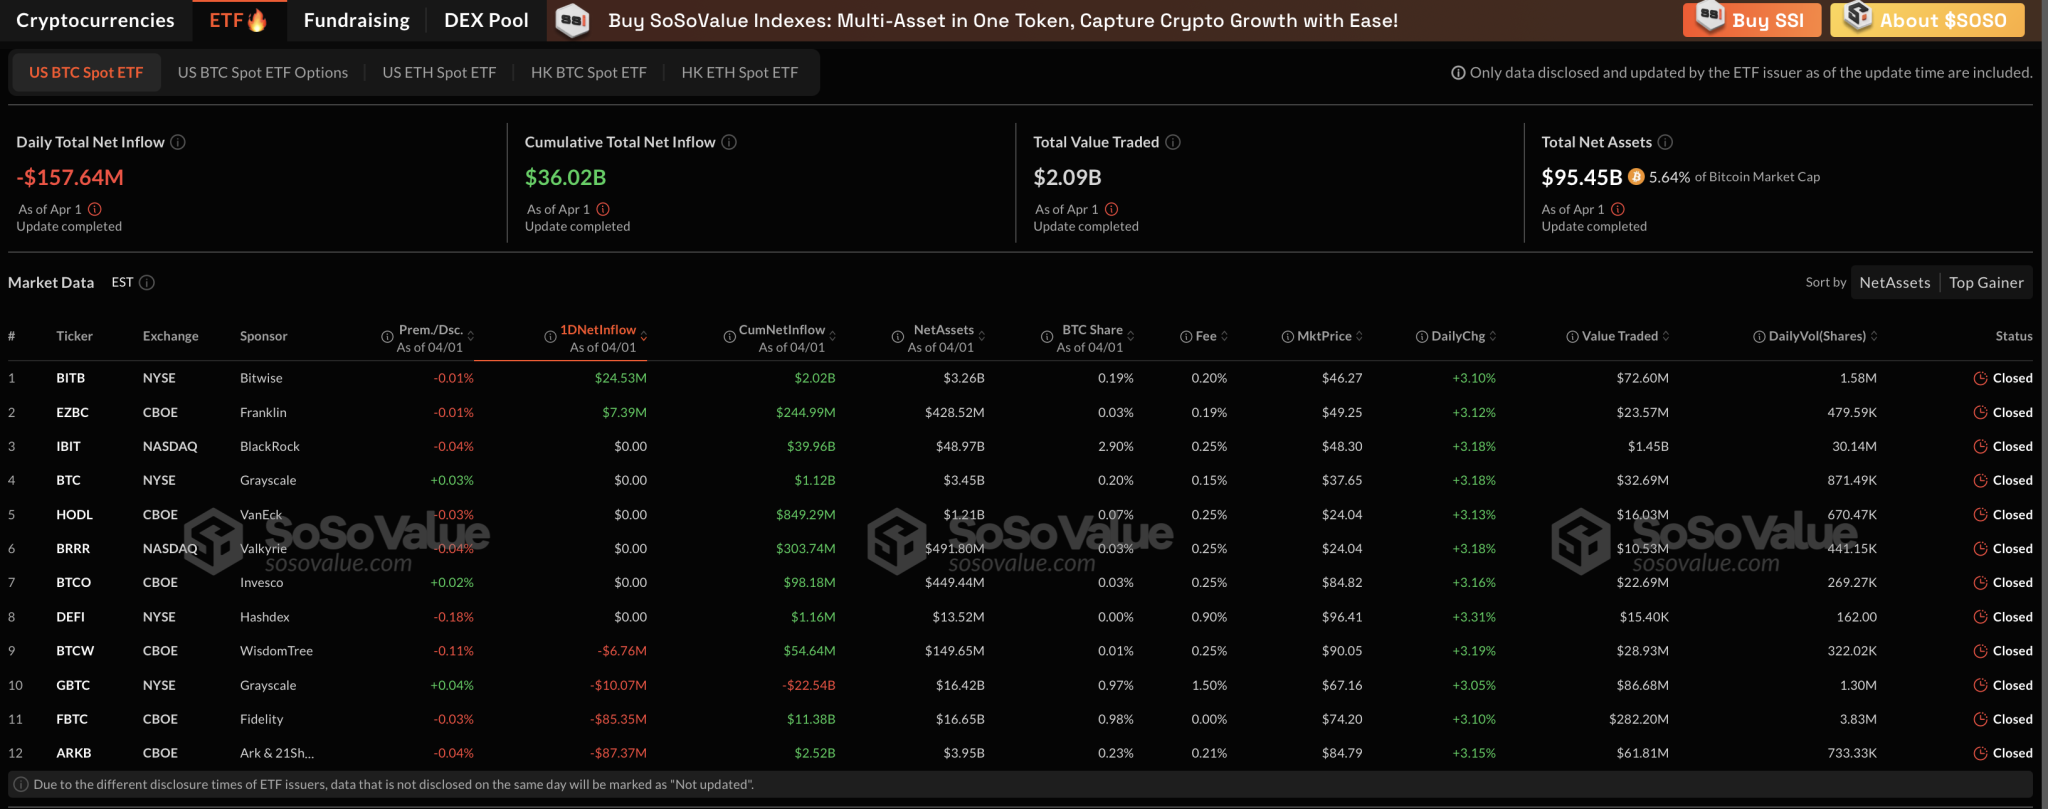
Amid increasing volatility, the U.S. Bitcoin spot ETFs have continued to experience outflows. On April 1, the daily total net outflow from U.S. Bitcoin spot ETFs was $157.64 million.

ARK 21Shares experienced the largest outflows for the day, with $87.37 million. Fidelity, Grayscale, and WisdomTree followed with $85.35 million, $10.07 million, and $6.76 million, respectively.

While six other ETFs saw net-zero flows, Bitwise and Franklin recorded inflows of $24.53 million and $7.39 million, respectively.

As of April 1, the total net assets of U.S. Bitcoin spot ETFs stand at $95.45 billion, representing 5.64% of Bitcoin’s market cap.

Bitcoin ETFs
Bitcoin ETFs

MetaPlanet Hits 4,206 BTC Out of Its 10K BTC Target

Despite the recent outflows in U.S. Bitcoin spot ETFs, Japanese investment firm MetaPlanet continues to bet on Bitcoin. With a recent $13 million purchase, the firm now holds 4,206 BTC.

This recent acquisition of 160 BTC came just a day after a massive purchase of 696 BTC. The current holding is now worth $360 million, making MetaPlanet the world’s ninth-largest publicly traded corporate holder of Bitcoin.

The company previously stated its goal to hold 10,000 BTC by the end of 2025 and aims for 21,000 BTC by the end of 2026.

Bulls to Dominate Bitcoin Futures?

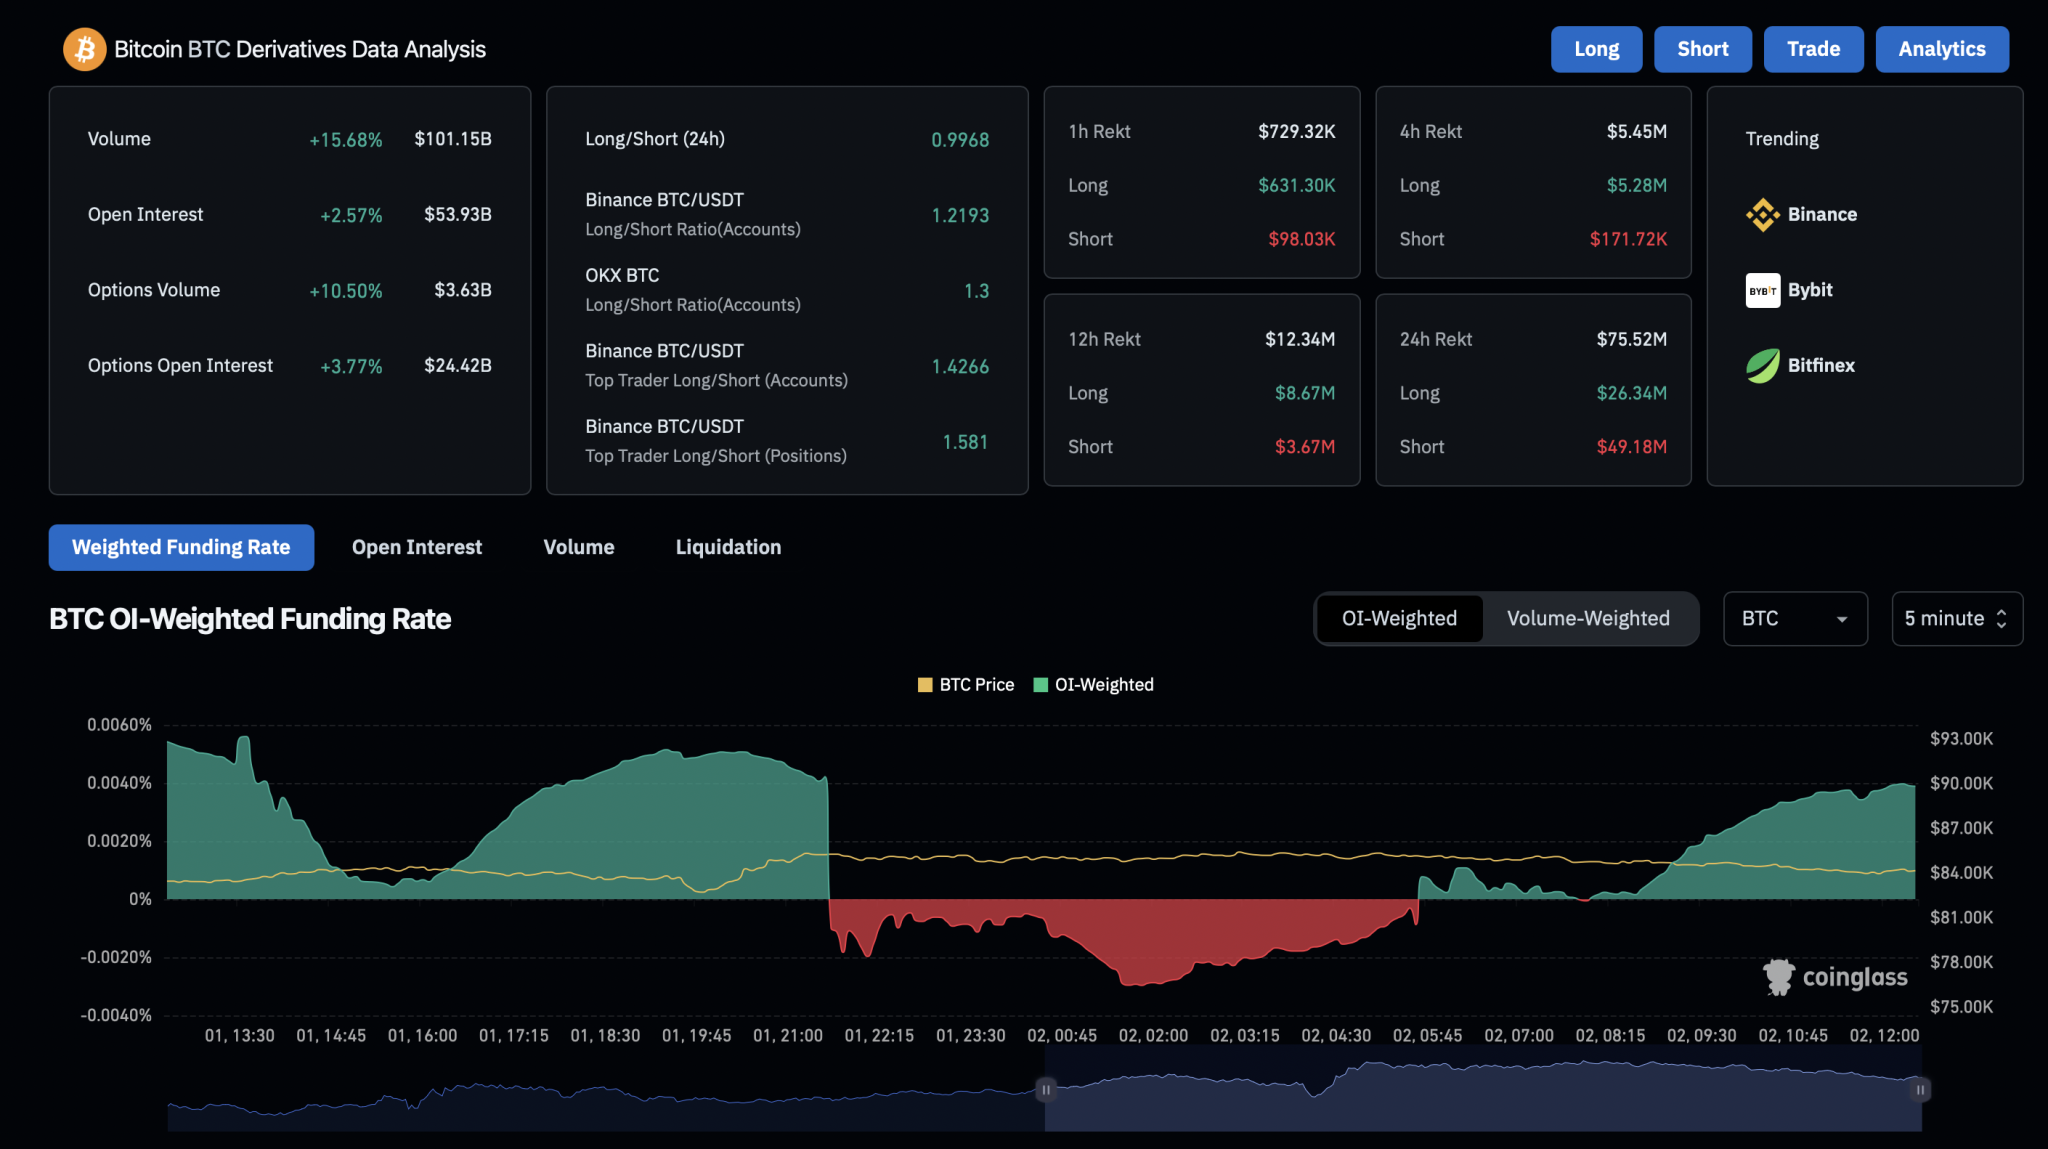
Increased volatility has driven many traders toward Bitcoin futures. Open interest has risen by 2.57%, reaching $53.93 billion.

The funding rate has entered a new positive cycle, reaching 0.0039%. This reflects strong bullish sentiment in the market, particularly when combined with the greater-than-1 long-to-short ratio observed on major exchanges like Binance and OKX.

Bitcoin Derivatives
Bitcoin Derivatives

Conclusion

The sudden surge in Bitcoin, coupled with rising open interest, suggests a leverage-driven rally. However, for the uptrend to sustain in the short term, a breakout above the trendline is necessary.

Based on Fibonacci levels, the recent price rejection at the 61.80% level could target the 78.60% level at $91,780 with a trendline breakout. Optimistically, the uptrend could continue toward the previous swing high near $106,000.

On the downside, Bitcoin’s immediate support level, under the 61.80% level, is around $75,500.

WeRate Founder Explains Why He Believes Bitcoin Price Has No Top

0

An expert analyst and founder of WeRate recently suggested that Bitcoin price has no top, amid correlation with rising global liquidity.

Bitcoin’s price has demonstrated notable fluctuations over the past week, with values ranging between $81,000 and $88,000. The asset experienced a downward trend, followed by a recovery on April 1, which saw the price briefly surpass $85,000 before retreating to $84,000. 

This volatility is a product of the ongoing uncertainty in the market, but the overall trend has been positive, with Bitcoin gaining 1.3% in the last two weeks. Despite the short-term fluctuations, macroeconomic factors reveal a silver lining for Bitcoin’s future.

Bitcoin and Global M2 Money Supply Correlation

Notably, a recent analysis from weRate founder Quinten Francois has drawn attention to the correlation between Bitcoin’s price and the Global M2 Money Supply. Global M2 Money Supply refers to the total amount of money circulating in the global economy, including both physical currency and more liquid forms of money.

This comparison, spanning from December 2023 to March 2025, showcases the rising trend of Bitcoin’s value alongside the increase in global liquidity. Bitcoin’s price surged from about $40,000 in December 2023 to above $100,000 by 2025. 

Meanwhile, the global M2 money supply rose steadily from $100 trillion to around $108 trillion by December 2025. Central bank policies globally have consistently injected liquidity into the economy, which aligns with Bitcoin’s upward trajectory.

Notably, there is no limit to the global money supply growth, as it continues to expand as long as fresh liquidity injection persists. Quinten suggests that, as Bitcoin persistently follows the M2 money supply growth, which has no limit, the firstborn crypto would also have no actual price top.

Global Liquidity Trends Since 2014

Elsewhere, another analysis, conducted by Coinvo, confirms the correlation between Bitcoin’s price and global M2 money supply. The data reveals a consistent pattern where Bitcoin’s value rises alongside global liquidity growth, corroborating Quinten’s findings.

Since 2020, particularly, Bitcoin has shown significant price increases that correspond with surging liquidity, driven by monetary policies like quantitative easing. 

The chart illustrates a clear correlation between the two, suggesting that if global liquidity continues to grow, Bitcoin’s price may also experience similar upward momentum.

Bitcoin Hash Ribbons Buy Signal

In addition to global liquidity trends, another indicator on the radar is the Bitcoin Hash Ribbons Buy Signal. According to Master of Crypto’s chart, the technical indicator has historically been reliable in signaling bullish movements for Bitcoin. 

Previous buy signals have preceded substantial price gains, with the last three signals resulting in price increases of 63%, 63%, and 120%, respectively. The most recent signal has sparked expectations of further price appreciation, with the analyst predicting that BTC could reach $110,000 in the next cycle. Currently, Bitcoin trades for $85,022, up 0.85% in the past 24 hours.

Here’s a Possible Reason XRP Price Crashes After Each Spike

0

A prominent XRP market commentator triggers speculation regarding the factor behind XRP’s sudden crash after each price spike.

Notably, XRP has faced persistent price volatility amid numerous positive developments surrounding the token. Despite progress in the race to launch an XRP ETF, its inclusion in the U.S. digital asset stockpile, and recent breakthroughs in the Ripple vs. SEC lawsuit, XRP has struggled to maintain its gains. 

XRP Price Witnesses Sharp Declines After Sudden Spike

Instead, the asset has frequently experienced a sharp rise followed by a rapid decline, trading at the lower end of the $2 range at press time. This has triggered concerns among investors.

For instance, this pattern occurred on March 2, when President Donald Trump announced that XRP would be part of the U.S. digital asset stockpile. 

The token immediately surged by 34% in a single day, reaching $3. However, this rally was short-lived, as XRP dropped 18.83% the following day. The downtrend continued, pushing the price back to the lower end of the $2 mark.

Another instance occurred on March 19, after Ripple CEO Brad Garlinghouse confirmed that the SEC had abandoned its appeal against Ripple, bringing the legal battle closer to resolution. This news triggered an 11.32% price jump for XRP on the same day. However, within the next three days, the token shed nearly 7% of its gains.

Market analysts have questioned the reasons behind these rapid downturns, with some attributing the occurrence to natural market forces. Notably, assets often witness such sharp declines after hitting resistance during a sudden spike.

Van Code Points to Bitcoin Whale Manipulation 

However, a recent analysis from software engineer and market commentator Vincent Van Code suggests that Bitcoin whales might be responsible for these sharp corrections. 

He pointed out unusual activity in the XRP/BTC pair, where massive buy and dump movements have occurred. In turn, this triggers a cascading effect as arbitrage traders and bots adjust the XRP/USDT balance.

Van Code asked whether Bitcoin whales, who hold billions of dollars in BTC, were merely engaging in XRP swing trading or if their actions were part of a strategy to keep XRP from becoming a significant threat. He suggested that the repeated crashes might be an orchestrated effort rather than random trading fluctuations.

According to him, Bitcoin whales who amassed their holdings at extremely low prices could be using their wealth to manipulate the XRP market and prevent it from achieving sustained growth. 

He noted that similar dump patterns have previously occurred, pushing the XRP/BTC pair lower than before the initial surge. However, it bears mentioning that these suggestions remain unconfirmed.

Can a Higher Trading Volume Solve This?

Van Code then discussed the need for much higher trading volumes to counteract what he believes are the manipulative moves. According to him, a $40 to $50 billion trading volume for XRP could be sufficient. 

He argued that without a significant increase in volume, XRP would continue experiencing these abrupt corrections. Currently, CoinMarketCap data confirms that XRP has averaged $6 billion in 24-hour volume since March at the $2 price. Van Code speculated that, to hit the $50 billion volume mark consistently, the XRP price might have to surpass $5.

Some proponents believe institutional adoption and demand can help in the long run. Meanwhile, it is important to note that XRP is not the only asset suffering from such sudden price slumps. Bitcoin and altcoins like Cardano (ADA) also witnessed massive drops early last month.