Home Blog Page 859

Crypto Firms Are Eying Bank Charters Under Trump: Report

0

Several crypto firms are looking to become state or national banks under the Trump administration.

Under the pro-crypto administration of President Donald Trump, the crypto industry hopes to achieve unprecedented growth, and one way industry participants may be exploring is by becoming banks.

Crypto Firms Working on Bank Charter Applications

Several crypto firms are looking to become state or national banks under the Trump administration.

This is according to a Tuesday, March 18, Reuters report citing over six anonymous executives and several regulatory lawyers.

According to the latter, there has been an uptick in bank charter application discussions with clients “cautiously optimistic” of approval under Trump.

With bank charters, these crypto firms hope to bolster their legitimacy in the eyes of customers and bring down certain operating costs. For one, borrowing will become much easier for these firms as they can just reach into customer deposits.

While this transition carries what some might see as burdensome regulatory scrutiny and applications are notoriously slow to process, crypto firms are likely banking on Trump’s pro-innovation stance to usher in a wave of deregulation.

These firms have also likely been encouraged by statements from Trump’s regulatory appointees. Specifically, Federal Deposit Insurance Corporation (FDIC) Acting Chair Travis Hill and Federal Reserve Governor and Trump nominee for vice chair for supervision have called for a more streamlined bank charter application process.

The recent Reuters report follows reports that Trump is on the verge of signing an executive order to roll back rules that made it difficult for crypto firms to access banking services. These reports also suggested that the executive order will push the Federal Reserve to grant crypto banks master accounts.

Nasdaq Files with SEC to List 21Shares Polkadot ETF

The Nasdaq Stock Market has submitted Form 19b-4 to the U.S. SEC to list an ETF for Polkadot, managed by asset manager 21Shares.

In the filing, Nasdaq disclosed plans to list and trade shares of the 21Shares Polkadot Trust as commodity-based trust shares.

This latest move follows 21Shares’ initial filing of a registration statement with the SEC in January to launch the Polkadot Trust, a crypto ETF.

At the time of the initial filing, 21Shares stated that it expected to list the trust on the Cboe BZX Exchange. However, Nasdaq is now submitting an updated filing to list shares of the 21Shares Polkadot Trust.

Details of the Polkadot ETF

Under the management of 21Shares US LLC, the sponsor, the Trust will hold DOT, the native token of the Polkadot Network.

Notably, the DOT token will be in the custody of Coinbase. Further, the Trust will track the performance of DOT through the CME CF Polkadot-Dollar Reference Rate — New York Variant, calculated by CF Benchmarks Ltd.

The filing emphasized that the Trust will not engage in speculative trading or leverage and will only hold DOT. Notably, the Trust sells DOT tokens when shares are redeemed and uses the proceeds to settle the transaction in cash.

When the Trust creates or redeems shares, it transfers DOT in or out in exchange for blocks of 10,000 shares. Authorized financial firms provide cash to buy shares, and the Trust uses that money to acquire DOT through a third party.

Steps to Approval

The filing of Form 19b-4 for the Polkadot ETF brings the product a step closer to approval. Specifically, the next step is for the SEC to acknowledge the form submitted by Nasdaq. Upon acknowledgment, an eight-month timeline (240 days) opens for the SEC to decide whether to approve or reject the ETF.

Notably, 21Shares is not the only asset manager seeking a Polkadot ETF. Prominent asset manager Grayscale has also submitted an application to list a Polkadot ETF.

DOT currently ranks as the 21st biggest cryptocurrency by market cap, with a valuation of $6.71 billion. The news of the filing by Nasdaq has not impacted its price, as the token is trading at a 1.3% dip at press time.

Bitcoin Futures Volume Has Surged 32% Since Late February to $57B: Here’s What It Means for Prices

0

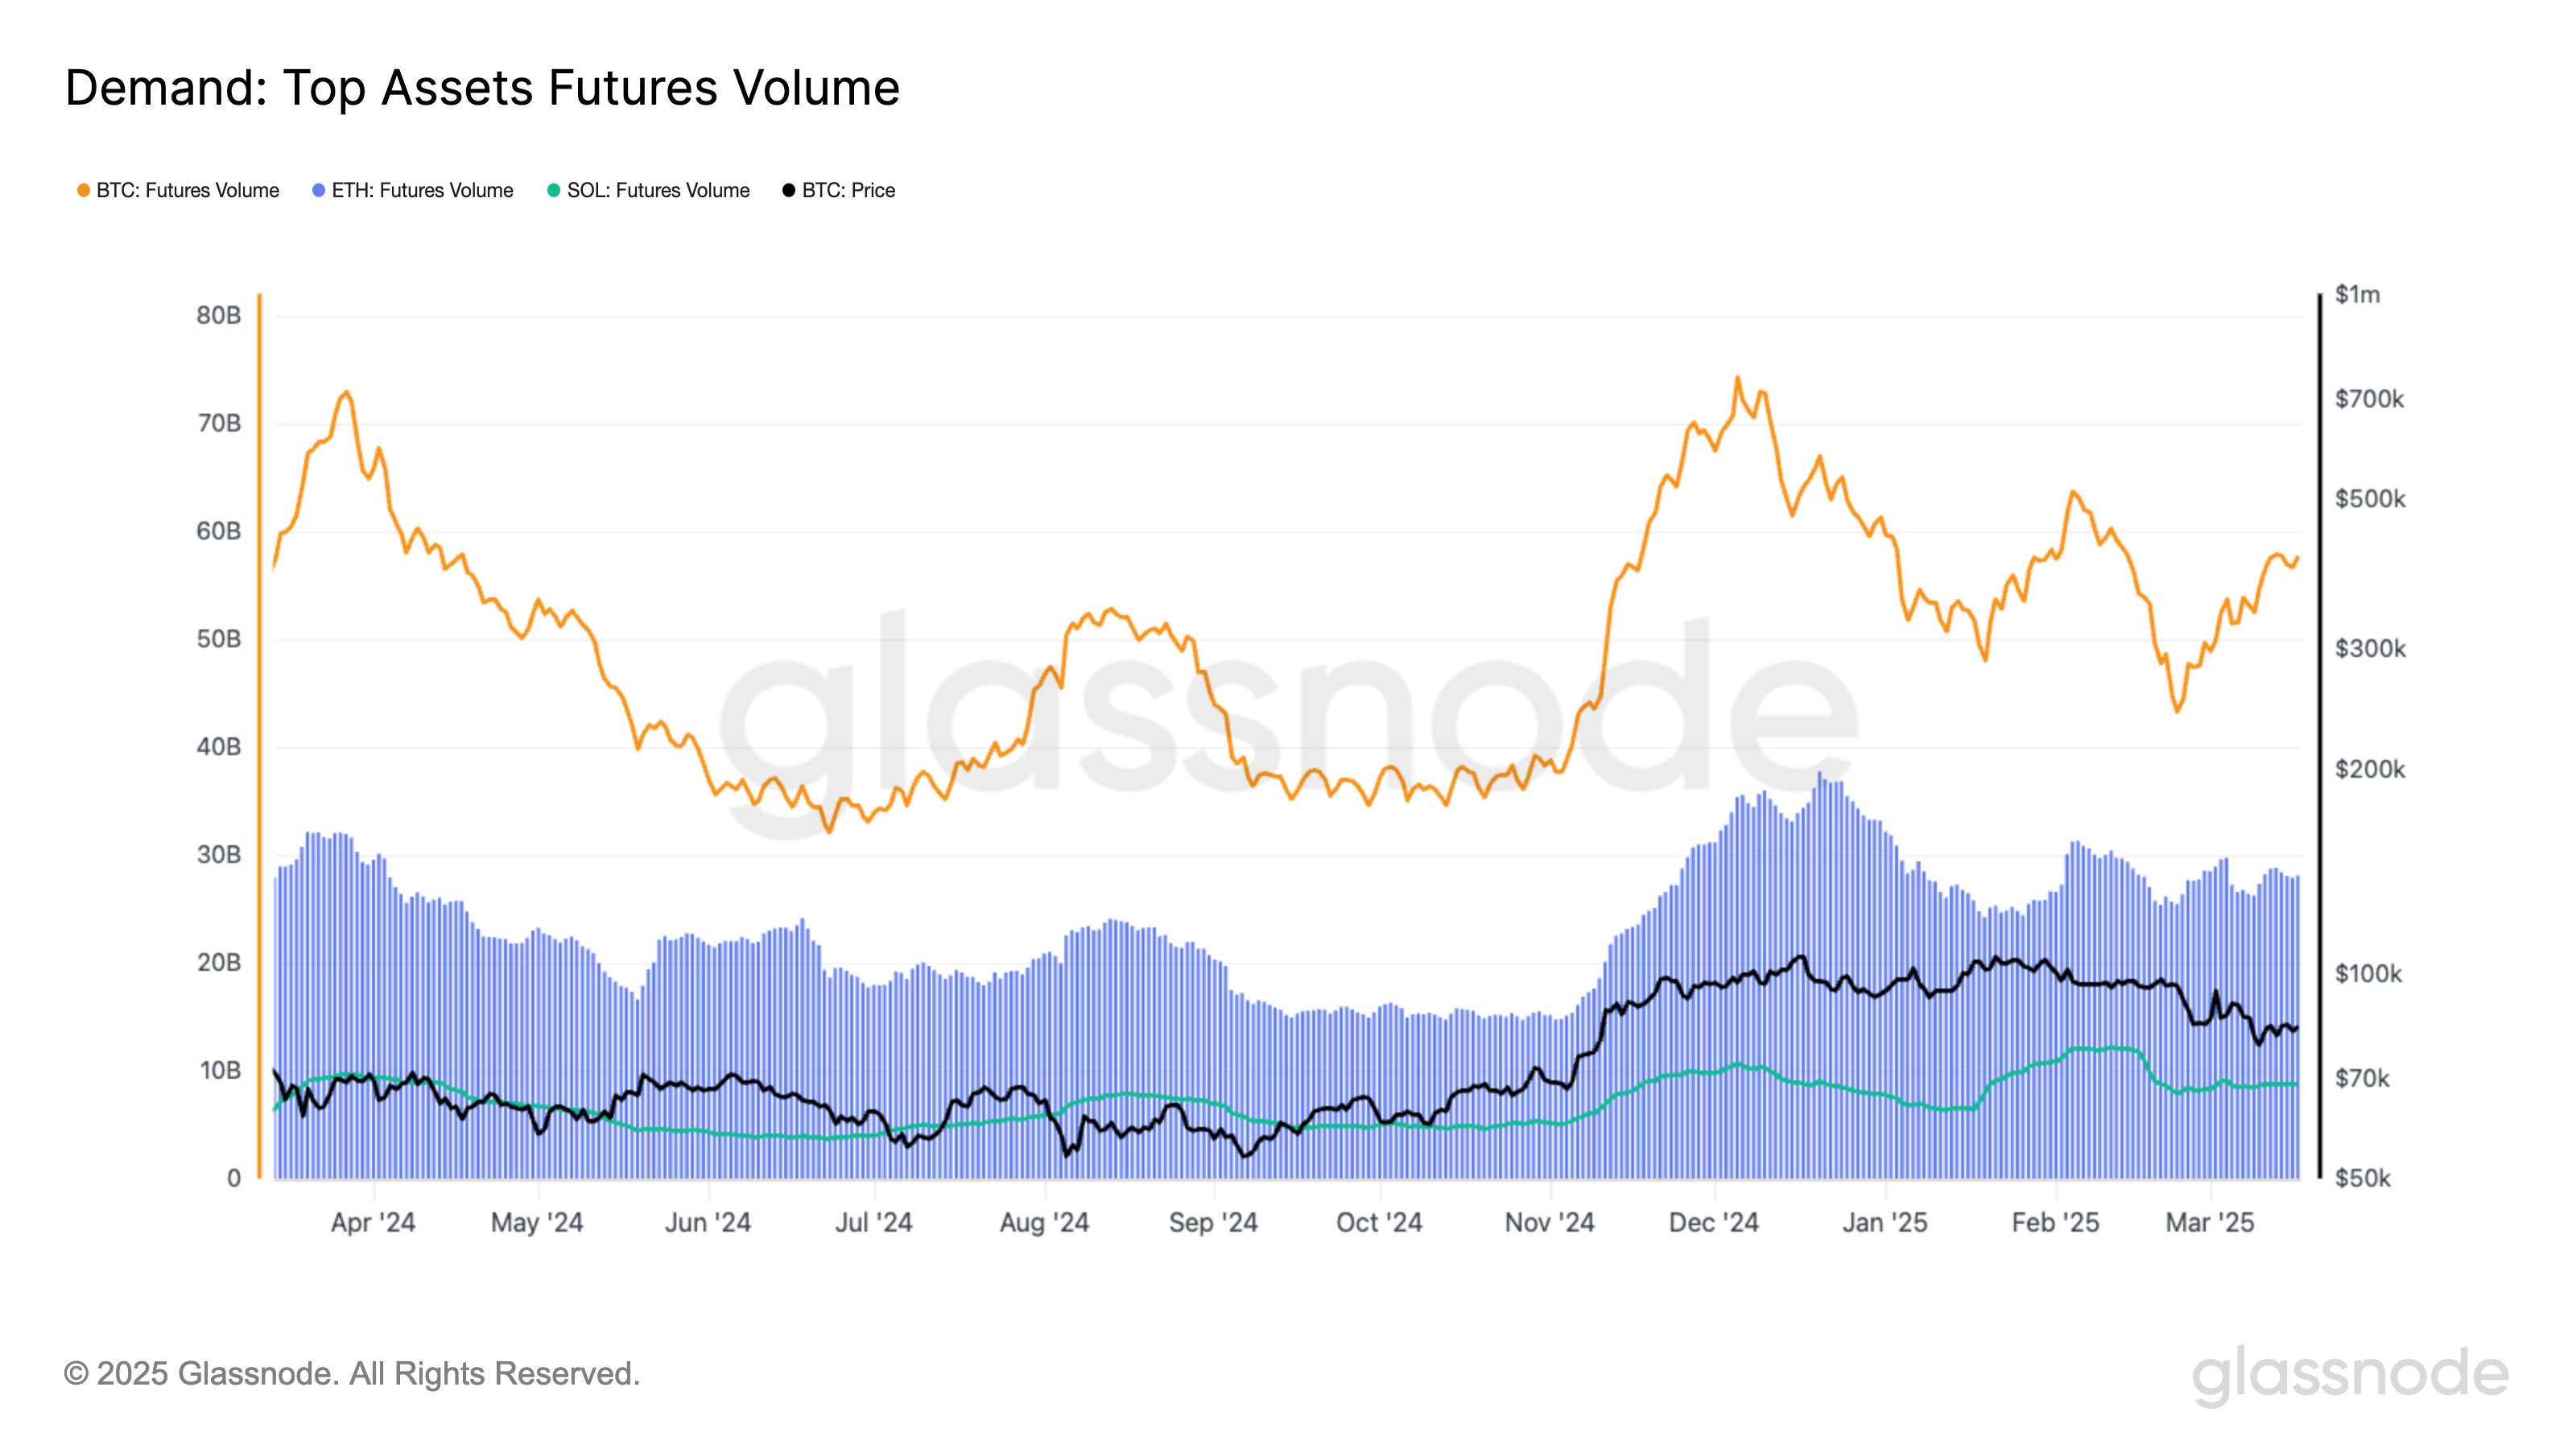
Futures interest in Bitcoin, the largest cryptocurrency by market cap, has rebounded considerably, with Ethereum and Solana derivative volumes remaining flat.

While Bitcoin, Ethereum, and Solana have seen similar downward price action, interest in the assets has diverged. For perspective, BTC remains largely unchanged, while Ether and SOL have corrected 2% and 1% in the past seven days.

Meanwhile, data from Glassnode shows that Bitcoin’s futures volume has diverged from Ethereum and Solana’s, signaling mixed market interest. Traders have opened more leveraged positions in Bitcoin pairs compared to the earlier-mentioned assets, raising optimism about a possible price swing.

Bitcoin Futures Volume Rebound

Per the Tuesday analysis, Bitcoin futures volume has rebounded from recent lows, spurred by renewed interest in the asset. At the start of the year, the worth of futures trading activities in the Bitcoin market stood at $60 billion.

Meanwhile, increased market participation saw the volume hit its current yearly peak of $63 billion in February. However, the recent market uncertainties have reduced traders’ appetite to speculate on Bitcoin’s short-term price actions, causing a sharp fall to early $40 billion.

Now, Glassnode shared a changing narrative, as traders are back trading the asset. Notably, volume has increased by 32% from February 23 and now sit at $57 billion. Nonetheless, it remains well below December’s peak of $74 billion.

Bitcoin Futures Volume Heatmap

As expected, Coinglass data shows that over $18 billion of these volumes came from Binance. Bitget, OKX, and Bybit also hold significant shares, with $10.23 billion, $8.37 billion, and $7.18 billion, respectively.

Ethereum and Solana Remains Flat

Meanwhile, futures volume for Ethereum and Solana has remained flat despite Bitcoin’s growing trader interest. For perspective, Ethereum’s derivative volume opened the year at $32 billion and reduced considerably before hitting $31 billion.

The asset’s futures volume stands at $28 billion, remaining almost unchanged recently. Moreover, it is nearly $10 billion off its peak volume of $37 billion last year as Ethereum’s price continues to falter.

Ethereum Futures Volume Heatmap

Traders also feel the same about Solana, which has recently been marked with intense pessimism amid several high-profile meme coin fallouts. Futures volume stands at $8.7 billion, down 29% from its year-to-date high of $12.2 billion.

Solana Futures Volume Heatmap

What It Means for Prices

Notably, leveraged interest in an asset is a two-edged sword, which could drive prices higher or lower depending on traders’ predominant sentiments. Increased volume equals more market liquidity, which could considerably impact Bitcoin’s prices.

Meanwhile, Coinglass shows the long/short ratio on Bitcoin derivatives is neutral to slightly bearish, standing at 0.988. Further details per exchange reflect more bullish data, with Binance and OKX at 2.16 and 2.43, respectively.

Long Short Ratio
Long/Short Derivative Ratio/Coinglass

With growing volume and more bullish bets, Bitcoin could react positively. In the meantime, the premier asset trades at $81,713, down nearly 2% in the past 24 hours.

Shiba Inu: Shibarium Burn Portal Torches 713,128,264 SHIB As Burn Rate Jumps 10%

0

The official Shiba Inu burn portal, Shib Torch, incinerates hundreds of millions of SHIB.

Shibarium Updates (@Shibizens) highlighted the development today, providing insights into Shib Torch’s overall activity.

Shib Torch Burns Over 713M SHIB 

According to the post, the portal has burned a total of 713,128,264 (713.12 million) SHIB as of March 18. With Shiba Inu currently trading at $0.00001251, these 713.12 million SHIB tokens are worth $8,921. This represents the total amount of SHIB incinerated through the Shib Portal since its launch in August 2024.

Meanwhile, the portal’s deflationary efforts have intensified over the past week. Its burn rate has spiked by double-digits to 10.02% within this time frame. 

Shib Torch Process and Upcoming Burns 

For context, these burns are funded with a portion of Shibarium’s transaction fees. Initiating transactions on Shibarium requires users to pay a base fee, which is automatically locked in a burn contract. 

However, users who want validators to prioritize their transactions during network congestion can include a priority fee allocated to the validator. 

Of the total base fee, initially paid in BONE, 70% will be converted to SHIB and burned. This 70% will be accumulated until it reaches a threshold of 1,000 BONE, currently worth $220. Upon reaching this milestone, any user can initiate the burn process. 

At the moment, 445.93 BONE have been accumulated for the next burn. At the current exchange rate, this figure would lead to the incineration of 7,832,860 (7.83 million) SHIB tokens. 

BONE accumulated for incineration

Potential Impact of SHIB Burn 

Although the amount of SHIB the portal has burned so far represents only a fraction of Shiba Inu’s circulating supply, these efforts are expected to positively impact the token’s price action in the future. 

As more tokens are permanently removed from the supply, this could potentially create scarcity, allowing the value of the remaining tokens to surge.  

Besides Shibarium, the community is also engaged in other initiatives to intensify burns. For instance, some users send SHIB directly to the official dead wallet, enhancing Shiba Inu’s burn campaign. 

Overall, more than 410.74 trillion SHIB have been removed from circulation since Shiba Inu’s inception. Of this amount, 15,493,929 (15.49 million) tokens were burned over the past 24 hours, leading to a 6.18% surge in the burn rate. 

Currently, Shiba Inu has a total supply of 589.25 trillion, with one SHIB currently trading at $0.00001251. 

Here’s How Many Shiba Inu Holders That Hold SHIB Worth $1M or More

The number of Shiba Inu millionaires has continued to decline as the price of SHIB struggles under bearish pressure.

Today, Shiba Inu registered another 4.2% dip, worsening its recent price performance. For context, at the current value of $0.00001254, those who have been holding Shiba Inu for over a year are facing an astonishing 56% loss.

This significant bearish performance has impacted the number of Shiba Inu millionaires. Notably, SHIB millionaires, at the current price of $0.00001254, hold approximately 80 billion tokens.

Shiba Inu Addresses Holding SHIB Worth $1M or More

According to data from IntoTheBlock, 1,470 addresses are holding a Shiba Inu portfolio worth between $100K and $1 million. These wallets control $533.63 million in SHIB, representing a dip of $67 million from the collective net worth of $600 million in February.

Similarly, addresses with a balance worth between $1 million and $10 million in Shiba Inu currently total 799. These wallets hold around 175 trillion tokens, worth approximately $2.2 billion.

Last month, this tier of SHIB holders featured 880 addresses, with their portfolios valued at over $3 billion.

Meanwhile, wallets with balances exceeding $10 million in Shiba Inu have dwindled to just 62. In February, there were 75 wallets with over $10 million in SHIB.

The notable decline in Shiba Inu millionaire addresses closely mirrors the dip in its price over the past month. At its current value of $0.00001250, Shiba Inu has fallen by 23% on the monthly chart.

IntoTheBlock chart showing addresses holding Shiba Inu

Addresses Holding 1M SHIB Tokens

Just as Shiba Inu whales have felt the heat of SHIB’s price dip, retail wallets have not been spared.

Notably, wallets holding between 1 million and 10 million SHIB tokens have decreased to 568,950, down from 570,000 last month. This implies that some of them sold off SHIB during this time.

For context, wallets holding this range of Shiba Inu are worth only $12 to $125 individually. Collectively, they hold 2.05 trillion SHIB, worth $26.67 million.

Additionally, around 496,750 wallets hold fewer than 1 million SHIB tokens. These wallets control a total of 142 billion SHIB, valued at approximately $1.84 million.

Furthermore, data from IntoTheBlock reveals that 301,690 addresses are holding between 10 million and 100 million SHIB. Collectively, they manage $121 million worth of SHIB, down from $160 million last month.

Dogecoin Bullish Signal: Whale Wallets and Active Addresses Reach 4-Month Highs Amid Market Dip

0

Santiment data shows that Dogecoin whale wallets have been recovering since February, while active addresses have hit a 4-month high.

Dogecoin has experienced a steady downtrend over the past month, aligning with declines in the broader memecoin market. While the short-term movement remains negative, recent on-chain data and technical indicators suggest potential signs of recovery.

Whale Accumulation and Network Activity

According to data from Santiment, Dogecoin’s on-chain metrics highlight bullish signals, particularly in whale accumulation and network activity. Since February 2025, the number of wallets holding at least 1 million DOGE has increased by 62, marking a 1.24% rise. 

This accumulation by large holders, often referred to as smart money, signals potential confidence in the asset’s long-term outlook despite the recent downtrend.

Meanwhile, daily active addresses interacting with Dogecoin have surged past 150,000, the highest level recorded since mid-November 2024. This increase in active wallets suggests higher user engagement within the Dogecoin network. 

Image

Confirming this surge in active addresses, network data by IntoTheBlock from the past week shows significant growth. New addresses rose by 102.4%, active addresses increased by 111.32%, and zero-balance addresses grew by 155.58%.

Dogecoin Daily Active Addresses

Technical Indicators and Potential Breakout

Furthermore, technical analysis points to a possible price shift. A well-followed market analyst, Trader Tardigrade, has noted the formation of a doji candlestick on Dogecoin’s weekly chart.

A doji occurs when an asset’s opening and closing prices are nearly identical, signaling indecision in the market. While neutral on its own, this pattern can indicate a shift in trend when placed in a broader market context. Notably, a similar pattern preceded Dogecoin’s 240% surge in Q4 2024.

Another analysis from TradingView highlights Dogecoin’s potential breakout from a multi-month falling wedge. The market watcher emphasized that maintaining the support level is critical for further gains.

The analysis outlines potential price targets, with the first profit level at $0.4638 and the second at $0.5534. The final target stands at $0.6542, representing a possible 281% increase from the current price.

Dogecoin Price Movements

Over the past 24 hours, Dogecoin’s price has declined by 2.1%. However, the 7-day trend shows a 4.9% increase, indicating short-term recovery. In contrast, the 14-day performance remains bearish with a 14% drop. 

Despite these fluctuations, DOGE has maintained support at $0.15, which has held strong during recent market movements. 

US Liquidity Bottom Flashes Hope for Bitcoin Rebound

0

U.S. liquidity may be bottoming out, according to Capriole Investments founder Charles Edwards.

The vibes in the Bitcoin and crypto community have been anything but immaculate in the past two months. After blistering price rallies in Q4 2024, many had anticipated more of the same in Q1 2025, especially in light of President Donald Trump’s crypto-friendly stance. But reality has been quite the opposite.

Bitcoin has tanked almost 25% from its highs, and several altcoins have lost double that. Amidst this rout, one analyst has highlighted a potential lifeline even as others assert that we are now in a bear market.

U.S. Liquidity Finds Bottom?

According to Capriole Investments founder Charles Edwards, U.S. liquidity may be bottoming out.

In an X post on Tuesday, March 18, Edwards asserted that the metric was flashing “the first signs” of what could be a major multi-year bottom.

Specifically, he noted that the metric appeared to be forming “an Eve/Adam bottom,” which refers to a typically powerful reversal pattern combining a V (Adam) and U (Eve) shaped candlestick formation. It acts similar to a double bottom.

US liquidity imposed on Bitcoin price chart
US liquidity imposed on Bitcoin price chart. Source: Charles Edwards

Why It Matters for Bitcoin

U.S. liquidity finding a bottom and rising is important for Bitcoin as excess liquidity often finds its way to risk markets like crypto. As highlighted by Capriole, crypto’s 2021 bull cycle was largely attributed to a rise in this liquidity. However, it has remained largely flat in the present cycle, explaining some of the market’s struggles.

The hedge fund founder noted that 2025 could be the right time for the Federal Reserve to move away from economic tightening as Trump’s tariff policies spark recession concerns.

The potential U.S. liquidity bottom formation comes as analysts like CryptoQuant CEO Ki Young Ju have asserted that we are in a bear market, warning of continued sideways or even bearish price movement in the coming months. Young Ju specifically pointed to a lack of fresh liquidity in his outlook.

While a potential boost in U.S. liquidity could theoretically invalidate Young Ju’s thesis, it does take a while for the liquidity to flow into crypto markets.

Expert Predicts XRP Price If Bitcoin Surge to $145K in Two Month Time

0

Tony Edwards, the host of the Thinking Crypto podcast, projects a scenario where a resurgence in the bull run could push Bitcoin, Ethereum and XRP to new ATHs. 

The recent performance of major crypto assets like Bitcoin, Ethereum, and XRP has left many investors disappointed despite XRP showing greater resilience than the rest of the market.

BTC, ETH, and XRP Fall from Recent Highs 

These assets have lost most of the gains accumulated after Donald Trump’s re-election in November. For instance, Bitcoin, which surged to an all-time high of $109,114 on Inauguration Day, January 20, is down 24.12% to $82,787. 

Ethereum was trading at $1,897 in the hours before press time, despite soaring above $4,000 in December. 

XRP, which became the third-biggest crypto by market cap following its remarkable post-election performance, has dropped to the fourth position. XRP soared to $3.38 on January 16 but has since plunged 32.54% to $2.28. 

This downturn has spread across the broader crypto market, with top assets also experiencing similar price declines. 

Thinking Crypto Host Remains Optimistic 

While many investors are expressing disappointment in the heavy downturns, Edwards seems optimistic about the market’s potential. 

He imagines a hypothetical scenario in which the prices of the top three crypto assets by market cap–BTC, ETH, and XRP (excluding stablecoins)—hit ambitious targets within the next two months.

Notably, he sets Bitcoin’s target at $145,000, Ethereum at $7,000, and XRP at $5. Achieving these milestones would require Bitcoin, Ethereum, and XRP to rise 75.14%, 269%, and 119% from their current prices of $82,787, $1,897, and $2.28, respectively. 

For context, Bitcoin will have a market cap of $2.87 trillion if it clinches the $145,000 target. Also, Ethereum and XRP’s valuation will rise to $844.37 billion and $290.54 billion at the projected targets, respectively. 

Edwards did not highlight a possible factor that could trigger such rallies. Apparently, the post was an attempt to spark discussion, excitement, and possibly a little FOMO (fear of missing out) among his over 131K X followers. 

Despite the speculative nature of the analyst’s recent disclosure, it reflects growing bullish sentiments in some parts of the crypto community.

Similar Predictions 

For context, several experts have issued similar targets for some of these cryptos. In January, CryptoQuant forecasted that Bitcoin would target a minimum price of $145,000 this year, potentially driven by pro-crypto regulation and strong institutional adoption.

In the same month, popular crypto chartist Ali Martinez forecasted that Ethereum could hit a price target of $7,000 this bull cycle. Also, leading asset manager Bitwise set a similar target for the second-biggest cryptocurrency. As previously reported, the top asset manager predicted that Ethereum will rise to $7,000 this year. 

Similarly, pseudonymous crypto analyst Altcoin Moe believes that XRP will register a new all-time high of $5 this cycle. Furthermore, Martinez recently suggested that the $5 target for XRP is achievable, asserting that the asset must first “break above the right shoulder at $3.”

While these predictions look appealing, investors must tread carefully when investing in crypto, especially during this highly volatile period. 

Burwick Law Files Lawsuit Against LIBRA Token Creators, Seeking Compensation

0

Prominent crypto law firm Burwick Law has filed a lawsuit against the entities tied to LIBRA token, seeking disgorgement of profits and compensation for losses.

The LIBRA token saga has taken another legal twist amid heightening tension between its creators and Argentine prosecutors. This time, investors in the United States have unanimously filed a lawsuit against the firms affiliated with the controversial meme coin.

On Monday, Burwick Law announced a lawsuit against Kelsier Ventures and two crypto platforms, Meteora and KIP Protocol. The legal firm sued the involved parties on behalf of its aggrieved clients at the Supreme Court of New York.

Affected Investors Seek Recompense

Notably, the lawsuit accused Kelsier, KIP, and Meteora of misleading retail investors into acquiring the “scam” token, leading to massive losses. Notably, The Crypto Basic earlier reported that 86% of wallets that bought the LIBRA token lost a combined $251 million.

The lawsuit branded the token’s launch “deceptive, manipulative, and fundamentally unfair,” citing several instances of insider foul play. Burwick highlighted cases such as the one-sided liquidity addition by the token’s developers on DEX Meteora, where they replaced Solana and USDC on the liquidity pool with LIBRA.

Excerpt from Burwick’s Lawsuit

Additionally, it mentioned the “predatory” move to centralize LIBRA’s token distribution without due disclosure. Per reports, over 83% of the token’s supply was held in one cluster, making it easy for the project’s insiders to dump on well-meaning retail investors.

The lawsuit seeks to disgorge profits that the token creators unfairly realized. Notably, the team, led by Hayden Davis, made off with over $100 million, leaving over 13,000 LIBRA wallet holders with a minimum loss of $1,000.

Furthermore, Burwick pleads for the recompense of affected investors and payment for damages. The lawsuit also seeks injunctive relief mandating the team to never create “fraudulent tokens” in the future.

The Saga Drags On

The LIBRA token controversy emanated from a Feb. 14 tweet from Argentina’s President Javier Milei promoting a meme coin, which he said was in an attempt to inspire small business funding in Argentina. However, the effort went south as the bad actors behind the token leveraged his influence to allegedly defraud investors.

The token capsized over 95% after the president deleted the tweet, with the fallout catalyzing impeachment threats from the opposition party. However, Milei has insisted on no wrongdoing and called the ploy a politicization of his gesture to promote innovation in Argentina.

Moreover, the Argentine prosecutors have made efforts to freeze the $100 million gains generated from the LIBRA token scam while officially seeking the Interpol Red Notice on creator Davis.

PEPE Eyes 45% Rally to $0.000010 Amid Falling Wedge Breakout

Pepe price trend gains bullish momentum with a wedge breakout. Will this result in a 45% rally to the $0.000010 mark?

The meme coin is aiming for a bullish recovery as the market remains mildly optimistic for a potential bounce-back. PEPE’s uptrend could reclaim the $0.000010 psychological mark with a falling wedge breakout rally gaining momentum. 

However, the intraday pullback at a crucial dynamic resistance comes as a strong resistance. Will Pepe continue a sustained recovery to reach the psychological milestone? 

Pepe Eyes 45% Price Surge With Wedge Breakout 

In the daily chart, the PEPE price action reveals a bounce back from a local support trendline, gaining momentum. The bullish reversal has breached the overhead resistance trendline by avoiding a retest of the $0.0000050 psychological mark. 

Pepe Price Chart
Pepe Price Chart

This marks a bullish breakout of a falling wedge pattern. With a post-retest reversal, PEPE formed a bullish candle of a 12% surge on Monday. This marked a strong bullish start to the week and a post-retest reversal. 

However, the breakout rally in PEPE struggles to overcome the 20-day EMA line. With an intraday pullback of 4%, PEPE currently trades at $0.0000070. 

Despite the short-term struggle, the moving average convergence-divergence momentum indicator reveals a positive trend in the MACD and signal lines. The rising bullish histograms signal a potential recovery as the average lines trend closer to the positive territory. 

However, due to the prevailing downfall, the 20-, 50-, 100- and 200-day EMA lines have gained bearish alignment. Hence, the dynamic average lines could act as resistances along the recovery. 

Based on the Fibonacci levels, the breakout rally in PEPE could reach the 23.60% level at $0.00001025. This marks an upside potential of nearly 45% from the current market price. 

On the flip side, the crucial support remains at $0.0000060 and $0.0000050 psychological mark. 

Analyst Signals Potential Pepe Rally to $0.000010

Amid the recent recovery, Ali Martinez, a crypto analyst, highlights a strong bullish potential in Pepe. Per the analyst, the meme coin is on the verge of creating a bullish inverted head and shoulder pattern. 

The neckline of the inverted head-and-shoulders pattern is around $0.0000075. Additionally, the right shoulder of this pattern suggests the formation of a double bottom, with a baseline at $0.0000065.

The neckline of the double bottom aligns with the larger inverted head-and-shoulders pattern. As a result, an hourly close above $0.0000075 could trigger a strong bullish move.

According to the analyst, the breakout in Pepe could lead to a rally toward the psychological level of $0.0000105.