Top Whale Shuffles 4.43 trillion SHIB tokens as Shiba Inu eyes to reclaim the coveted $0.00001 price level.
Whale Alert, a leading blockchain tracking platform, recently detected unusual activity among top whale wallets. According to the disclosure, the largest Whale wallet moved 4,439,530,677,374 (4.43 trillion) SHIB, worth $35,915,803 ($35.91 million), to an unknown wallet. The gigantic transfer occurred about 14 hours ago from press time in a single transaction.
? ? 4,439,530,677,374 #SHIB (35,824,792 USD) transferred from unknown wallet to unknown wallethttps://t.co/CaQANroQWg
This move follows the whale’s previous feat on November 3, when it accumulated 4,454,530,677,374 (4.45 trillion) SHIB tokens, valued at $34,567,158 ($34.56 million), in a single transaction. The accumulation had propelled the whale to the 25th position on the list of the world’s largest SHIB holders.
However, the top whale is left with a zero SHIB balance following the recent transfer, per the latest data from Etherscan.io.
These rapid, high-stakes shifts of SHIB tokens among top whale wallets suggest the bullish move is on the horizon, with bulls setting their sights on reclaiming the coveted $0.00001 mark. Shiba Inu has remained under the $0.00001 threshold for the past ninety days, a fact previously reported by The Crypto Basic. The last time Shiba Inu canceled a zero was on August 12, and it has been trading with five decimal places since.
Shiba Inu Chart
For context, Shiba Inu must rally 20% from the current price to attain the $0.00001 mark. Meanwhile, SHIB is flirting with a critical resistance level at $0.00000825 on the daily chart. If the bulls successfully breach this barrier, Shiba Inu is poised for a 10% rally, targeting the next resistance level at $0.00000917. Conquering this level would be a significant milestone, setting the stage for a potential rally to reclaim the coveted $0.00001 mark.
Crypto-law founder Attorney John Deaton has made a surprising remark regarding the acquisition of XRP by institutional investors.
In his recent tweet, Attorney Deaton said he won’t be surprised if he finds out that no institutional investor acquired XRP above $0.60.
Excluding ODL transactions, I wouldn’t be surprised if there isn’t a single institutional investor who acquired XRP over 60 cents. https://t.co/GHJRomndAr
The prominent legal expert excluded XRP purchases made by Ripple’s On-Demand Liquidity (ODL) clients. It is noteworthy that Ripple’s ODL solution uses XRP as a bridge between two fiats during cross-border settlements.
Based on ODL design, users are required to acquire XRP to facilitate cross-border payments through the solution.
Expert Outlines Appropriate Remedies in Ripple Case
Deaton made the remark in response to Attorney Jeremy Hogan’s tweet highlighting the appropriate remedies Ripple could pay for violating federal securities laws in relation to its institutional sales of XRP.
Reacting to the Second Circuit ruling in the SEC v. Govil case, Hogan suggested that the decision could impact the outcome of the remedies phase in the Ripple lawsuit.
The Govil case, which was introduced in 2021, saw the SEC charge the defendant with engaging in a fraudulent securities scheme through a company named Cemtrex.
Despite Aron Govil’s acceptance of returning the proceeds obtained from the scheme, the regulator demanded an extra disgorgement.
A federal court granted the SEC’s motion for additional disgorgement, thus prompting the defendant to seek an appellate review. Interestingly, the U.S. Court of Appeals for the Second Circuit overturned the lower court’s decision and remanded the case.
This time, the Second Circuit instructed the federal court to grant disgorgement only if Cemtrex investors suffered financial losses.
Based on the Second Circuit decision, Hogan stated that XRP holders would need to have incurred losses for Ripple to be liable during the penalty phase of the SEC lawsuit.
However, an XRP enthusiast pointed out that the damages sought by the SEC would only cover institutional investors who lost money. This is because Judge Analisa Torres, in a July 13 ruling, found that Ripple violated the law via its past sales of XRP to institutional clients.
Reacting, Attorney Morgan agreed with the user, emphasizing that Ripple could be liable only for institutional investors who acquired XRP above $0.60.
Correct. And now, it's only institutional buyers who bought XRP for over .60 cents.
Notably, XRP was currently changing hands above $0.60 at the time of writing. According to data from CoinGecko, XRP was trading at $0.68, up over 9.3% in the past day.
Using the Second Circuit decision as a legal precedent for the upcoming remedies phase in the Ripple lawsuit, the blockchain company’s fine might cover only institutional investors who bought XRP above $0.68.
The remedies stage of the SEC v. Ripple lawsuit is expected to begin soon. The court has already ordered the parties to propose a joint briefing schedule for the remedies stage no later than November 9. So far, the parties have yet to comply with the order.
XRP wallet holders in the 100,000 to 1 billion range have hit the highest level for this year, contributing to an impressive upsurge in price.
Data from the crypto analytics platform Santiment shows that XRP’s valuation has also hit its highest level since August 2nd. The cryptocurrency’s price is currently worth $0.6767 after soaring 8.87% overnight.
? #XRPLedger is at it again, reaching a market value north of $0.68 for the first time since August 2nd. The 3-month high happened as $XRP moved up +23% against $BTC in just the past week. Wallets with 100K-1B $XRP now hold their highest level in 2023. https://t.co/v5wlgIQAhhpic.twitter.com/hvZbZ8S1UG
For the past three months, XRP’s growth seems decoupled compared to that of Bitcoin (BTC). Data from Santiment proves this, as XRP has jumped by 23% against Bitcoin over the past week.
The uptick in XRP appears encompassing, seeing its market capitalization is up 8.6% to $36,347,034,900 atop a trading volume up 157.66% overnight to $2,473,070,163.
Santiment shared some key elements of XRP’s ecosystem highlights, including the whale outlook and social dominance. The chart showed that XRP wallets holding 100,000 to 1,000,000,000 tokens now hold 45.8% of the total supply, a record high for the year.
This record is awe-inspiring, seeing the erratic growth in this class of XRP holders from August 12 to date. XRP whales were at an impressively high level from mid-August to around September 21, when the percentage of the total supply they held dramatically plunged. This whale account per total supply remained consistent until October 23 but welcomed intermittent spikes.
The rally recorded underscores the relentless nature of XRP whales amid positive legal clarity now associated with the coin in the US. To complement this whale outlook, XRP’s social dominance has also been at the highest rate since mid-July.
XRP Social Presence
As the price of XRP increases, the Santiment chart shows that XRP discussion on social media has witnessed the most significant spike since mid-July.
Notably, the XRP sentiment is growing because of the legal victories bagged by Ripple Labs against the US SEC from August to October. Beyond this, the outlook of the XRPL also presents immense opportunities that whales are banking on.
Many innovations are making their way to the XRP Ledger and though marked by controversy, the emergence of its sidechain, Xahau, has proven that beyond all odds, the XRPL protocol can compete with its Layer-1 peers with a positive upside for XRP in the long-term. Now that XRP has crossed the $0.65 mark, we cannot rule out the potential to hit the $1.10 to $1.40 price range in the long term.
XRP sees a 27% weekly surge and a significant 24-hour trading volume increase, coinciding with Ripple’s pivotal Swell conference in Dubai amid speculation of a transformative IPO announcement.
XRP’s cumulative price gains over the last seven days stand significantly at about 30%. Also, in the last 24 hours, the digital asset engineered a bullish surge to break above one of its highest points in three months: $0.68.
In parallel, crypto market participants traded $2,495,836,532 ($2.495 billion) worth of XRP within 24 hours, per CoinMarketCap data. The figure represents a 162.41% uptick from the value recorded on the previous day.
XRP Market Chart CoinMarketCap
XRP’s increased volume, which has impacted its price, comes amid a pivotal conference Ripple is hosting in Dubai.
Ripple Swell
Specifically, Ripple Swell, a gathering of the leading minds in finance, blockchain, and fiscal policy, is unfolding this Wednesday and Thursday in Madinat Jumeirah, Dubai.
@WKahneman suggests that this year’s SWELL event could hold significant announcements, with various possibilities, such as an Initial Public Offering (IPO), obtaining a license from VARA, discussions related to Central Bank Digital Currencies (CBDCs), developments in stablecoins and tokenization, and potentially attracting new users. After a year of relative silence, it may offer insights into whether Ripple still views itself primarily as a payment-focused company.
Moreover, the conference is set to welcome over 600 participants, feature 80 expert speakers, and draw representation from upwards of 40 nations.
Considering the significance of this event and its potential to shape Ripple’s business strategy, the XRP community is highly anticipative, speculating on various outcomes and the possible positive impact on XRP.
One of the leading points of speculation revolves around the possibility of Ripple using the event as a platform to announce its intention to go public through an initial public offering (IPO).
Potential Impact on XRP
Notably, Wall Street expert Linda Jones has posited that post-IPO, Ripple’s stock price could soar above $600. This increased attention might result in an upturn in XRP’s market value. Where Ripple’s stock price crosses $600, the possibility of XRP’s price reaching double digits could become a tangible prospect.
Although there are some concerns and negative sentiments regarding how a Ripple IPO might affect XRP, most XRP supporters believe such a move would be pivotal in promoting XRP adoption and driving its price.
Several key technical indicators point toward a sustained rise in XRP price, with fundamentals backing such an outcome.
After a bullish 9% gain in the past 24 hours, XRP has become the subject of much interest from the crypto investor community. Muses of a move above $1 have come back in contention, with experienced analysts eyeing a further substantial rise.
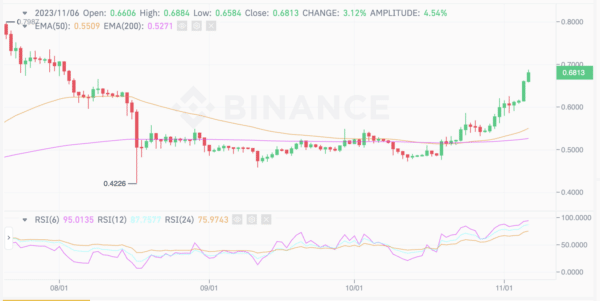
Interestingly, the bullish sentiment is also reflected in the technical charts, with XRP sitting pretty on key indicators. For instance, the asset recently climbed above the 50-day and 200-day estimated moving averages (EMAs) on the daily chart. Trading above these regions underlines sustained buyer interest over a significant period, thus largely considered a bullish indicator.
XRP Technical Analysis
Another interesting indicator pointing to further XRP gains is the asset’s relative strength index (RSI). At the time of writing, XRP seats comfortably above the 50 RSI mark, indicating higher buying pressure.
XRP is poised to see further gains with these major indicators in its favor. Ideally, the asset would also need to trade above these levels to avoid any bearish sentiment creeping in amongst investors.
As the above chart shows, XRP is currently trading at $0.681, representing a 9% gain in the past 24 hours.
Fundamentals Back XRP’s Technical Strength
Beyond technical charts, XRP is enjoying an impressive tailwind as Ripple continues to ramp up legal victories in its longstanding lawsuit against the United States Securities and Exchange Commission (SEC).
In addition to July’s landmark victory, which clarified that secondary XRP sales did not constitute securities transactions, the SEC has also notably pulled out of lawsuits against Ripple’s executives. Many investors consider the backsliding action by the regulatory agency as evidence that a settlement is near.
Meanwhile, XRP is also winning outside the shores of the United States. Last week, Ripple secured approval from the Dubai Financial Services Authority (DFSA) to offer XRP within the Dubai International Finance Center (DIFC). This specific approval allows digital asset custodians in the region to offer XRP-related services to investors.
In a nutshell, a combination of technical and fundamental developments has contributed immensely to XRP’s recent resurgence. Barring any significant negative news, investors will remain optimistic that XRP’s double-digit gains (22%) over the past week are just the start of a new bull run for the asset.
Expert chartist EGRAG predicts XRP’s breakthrough past $0.65 resistance as a prelude to a significant surge, setting sights on $1.10 to $1.40.
In the last 24 hours, XRP broke a pivotal resistance level to trade above $0.65. According to data from market tracking resources, XRP got as high as $0.688. Interestingly, it has been over 90 days since XRP last traded around its current point.
Now that XRP stands firmly at $0.6733, seasoned market commentators have offered their insights on the prospective price goal for XRP for the coming weeks.
XRP To Land between $1.10 and $1.40
In a recent tweet, renowned chartist EGRAG argued the next target for XRP is above $1. The foundation for EGRAG’s conviction in the accuracy of his prior prediction, where he foresaw XRP surpassing the $0.65 mark.
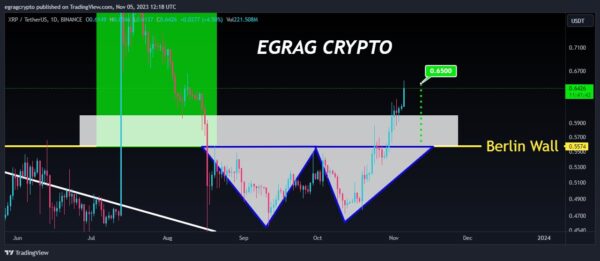
Last month, when XRP traded much lower at $0.54, EGRAG pointed out that XRP was carving out a ‘W’ formation on the charts. According to him, the pattern often indicates an impending trend reversal with “powerful momentum.” As a result, he projected XRP to reach $0.65 in the next month, which has now materialized.
Meanwhile, the analyst likened XRP’s resistance level challenges at the time to the historical Berlin Wall. He particularly argued that the resistance level was on the brink of collapsing. Therefore, he set his expectations high, projecting a potential price surge for XRP to land between $1.10 and $1.40.
Following the accurate prediction of the ‘W’ chart formation leading XRP to $0.65, EGRAG has now conveyed a strong belief in a more recent update. According to him, the next significant milestone for XRP is breaching what he previously referred to as the “Berlin Wall” of resistance.
As he has previously detailed, successfully breaking through this resistance barrier would result in XRP trading in the range of $1.10 to $1.40.
XRP’s next target to break the Berlin Wall
Possible Reversal Before $1.10, $1.40, $1.88, and $5.85
Meanwhile, EGRAG disclosed that before the rally above $1, a retest of the range between $0.55 to $0.58 is expected, followed by a rebound. Where the rebound materializes, the analyst argued it would be a confirmation for the price range between $1.10 and $1.40.
Notably, prominent analyst Dark Defender had expressed a sentiment similar to that of EGRAG. In his update, Dark Defender forecasted that XRP would reach $0.66 from $0.55. While he consented to a potential support level of around $0.52, the analyst issued higher targets of $1.88 and $5.85.
Deaton believes Ripple might pay a lower fee as penalties, making it difficult for the SEC to justify the amount of resources it spent during the legal battle.
Attorney John Deaton, a legal representative for the XRP community, has continued to shed light on the potential outcome of the upcoming remedies phase in the SEC v. Ripple lawsuit.
$731.5M Could Be Deducted From Penalty
In a tweet yesterday, Deaton speculated that Ripple could pay a lower amount as penalties instead of the $770 million fine the SEC seeks.
It is worth noting that the $770 million emanated from Ripple’s XRP sales to institutional clients, which the court found illegal in its July 13 ruling. As a result, Ripple could pay a fine of up to $770 million for violating federal securities laws through its institutional sales.
Interestingly, Attorney Deaton said Ripple could pay a lesser amount as penalties due to the SEC’s previous arguments. According to Deaton, the SEC mentioned in some of its briefs that 95% of Ripple’s XRP sales could be outside the United States.
Applying the figure to the $770M worth of XRP sold to institutional clients, Deaton noted that a whopping $731.5M will be deducted from the total sum, leaving only $38.5 million.
In addition, Attorney Deaton argued that Ripple would attempt to deduct legitimate business expenses from the expected penalties. Per Deaton, the SEC cannot justify the amount of resources it splashed on the Ripple case after the company pays the fine.
I would add also that in some of the briefs it mentioned that sales of XRP could be 95% outside of the United States. If that figure applied to Ripple sales (?♂️) to the $770M that would deduct $731,500,000, leaving only $38,500,000. Then deduct legitimate expenses and like I said…
Deaton Highlights How Ripple Could Secure a 99.9% Victory
Deaton commented a few hours after he rebuked crypto people who claim the SEC obtained a 50-50 victory. The XRP holders’ attorney stated that the court’s ruling was more like 90-10 in favor of the blockchain company.
The people who’ve argued that the SEC got a 50-50 victory in the @Ripple case are ? wrong. It was more like 90-10 in Ripple’s favor. If Ripple ends up paying $20M or less it’s a 99.9% legal victory. https://t.co/Xe6SYBiTCJ
Furthermore, the pro-XRP lawyer speculated that Ripple could end up with a 99.9% victory against the SEC if it pays only $20M or less as a fine.
It bears mentioning that the SEC v. Ripple case is currently in the remedies phase. The court has ordered the parties to submit a joint briefing schedule about the remedies on or before November 9.
However, if the parties fail to come to an agreement before the deadline, they shall jointly ask the court to provide a schedule for the briefing.
As the deadline approaches, top lawyers have been speculating on potential arguments the blockchain company might adopt during the remedies briefing.
Interestingly, Attorney Jeremy Hogan joined the discussion in a recent tweet. Citing the SEC v. Liu case, Attorney Hogan stated that the court found that disgorgement needs to be fair.
First, the SEC v. Liu case (2020) basically said that disgorgement is an equitable remedy which means that it should be "fair." And fair in this context means that it should be the violators NET profits, not GROSS.
So, Ripple will deduct business expenses from the total.
Consequently, Hogan asserted that Ripple would deduct its legitimate business expenses from the potential $770M penalties. He also predicted that sales outside the U.S. SEC jurisdiction would be removed from the total sum.
Furthermore, Attorney Hogan mentioned that the recent Second Circuit ruling, which held that disgorgement should be awarded for victims, could also play a significant role during the remedies briefing. As reported earlier, Hogan stated that XRP holders would need to have suffered financial damages for Ripple to be held liable.
Shiba Inu (SHIB) has a short-term goal of erasing one more zero, a move that shows its potential to hit higher price levels.
Destroying one zero from Shiba Inu’s current price of $0.000007895 will imply moving the decimal point forward. Attaining this goal is possible in the mid-term if SHIB soars by at least 25% from the current price point.
Shiba Inu Historical Metrics
The push to drive Shiba Inu’s price toward the $0.00001 price mark is not a feat it has not recorded in the past. With an All-Time High (ATH) of $0.00008845, Shiba Inu proves that canceling out a zero is attainable.
The token has plunged up to 91% since attaining this ATH on the back of erratic market sentiment due to the crypto winter. Though SHIB has showcased strong resilience in recent times, the 31.36% slump in its trading volume highlights a bull-bear case scenario.
A depressed trading volume is a sign of buying sentiment which can keep prices down. When users are not accumulating, the prospects of price recovery in the long term become slim. On the other hand, more vision-driven investors might consider this negative metric a baseline for the gradual breakout in price.
Low buying pressure accompanied by periods of elongated price suppression marks an entry point for investors who may think the worst is over. This latter sentiment is playing out at the moment as SHIB is up 1.98% to $0.000007879. The token’s market capitalization has also recovered, jumping at a similar rate to $4,644,702,487.
Triggers to Aid SHIB Resurgence
For Shiba Inu to continue on its upward trend, a mix of internal and external factors must align. The current Bitcoin spot ETF sentiment in the United States served as the industry’s central theme for October. With rumors about BlackRock’s approval, the market picked up momentum, led by Bitcoin, with significant rub-offs on altcoins like SHIB.
The speculation continues to grow that the SEC will approve the product in the coming months, with some categorically predicting its emergence this year. Based on projections, an actual approval of Bitcoin ETF may spark the next bull run, favoring Shiba Inu remarkably.
The development team behind Shiba Inu and its associated protocols have teased notable solutions they are working on. The prospects of these solutions are worth banking on for SHIB holders and community members in the bid to erase a zero and perhaps, chart the long ride toward the ultimate $0.01 price target.
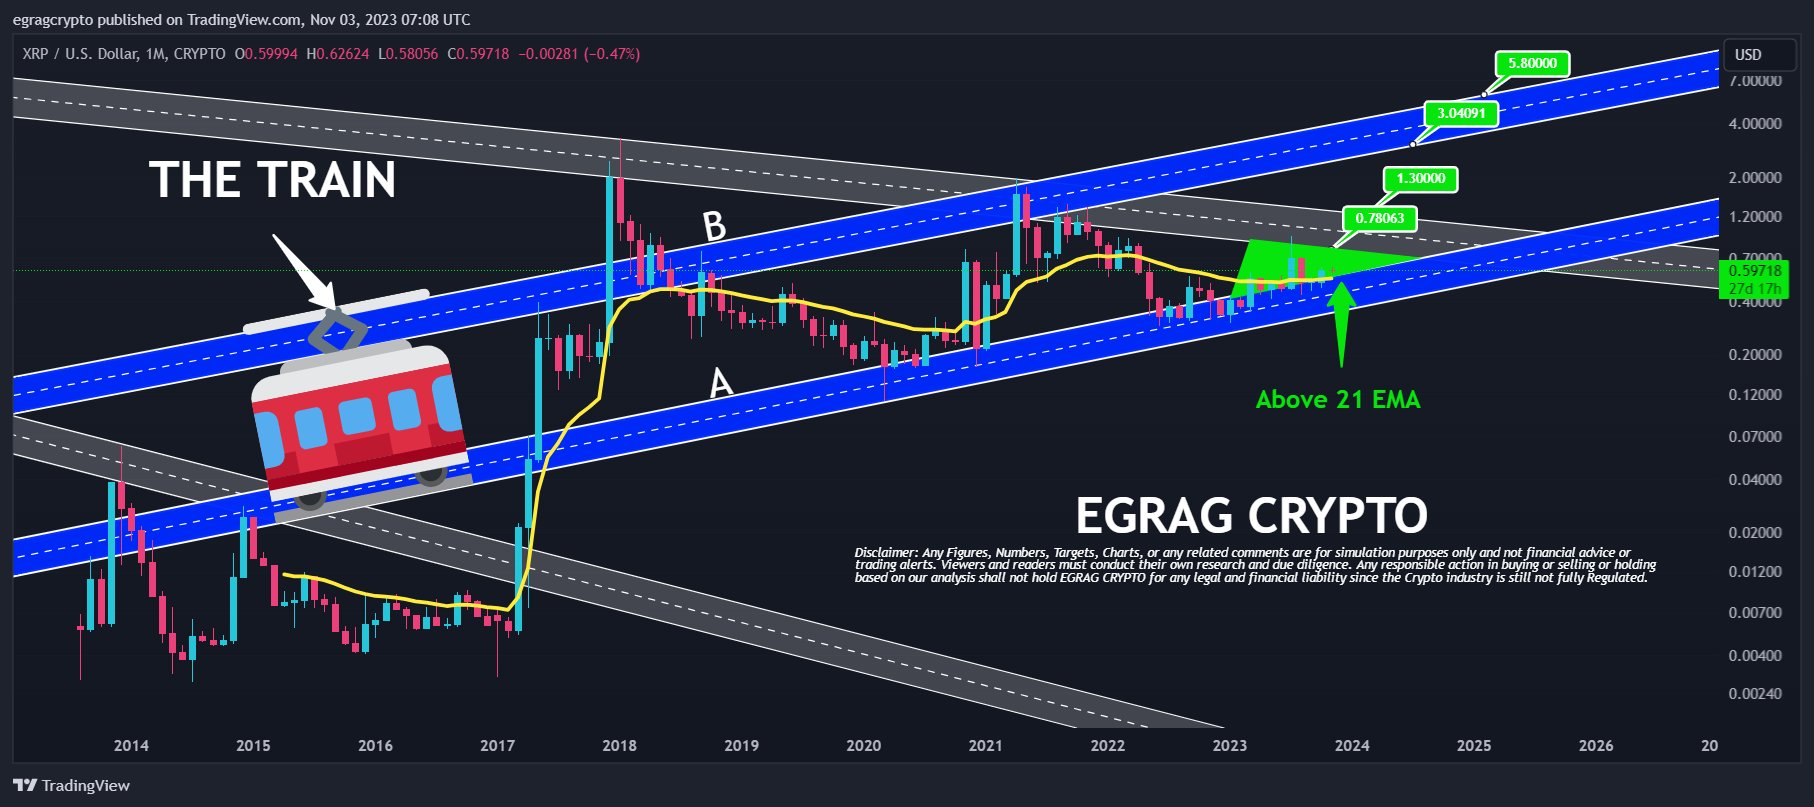
XRP has sealed a comfortable position above the 21 Exponential Moving Average (EMA) amid the ongoing uptrend, with top analyst EGRAG setting next targets at $0.8, $1.3, $2.8 and then $5.5.
The recent analysis is a follow-up report to an earlier post he made on the subject. Interestingly, the analyst noted in September that XRP is on the verge of a monumental price surge, having kickstarted the momentum to a level he calls “Valhalla.”
In the latest post, EGRAG presented an update on XRP’s price movements, noting that the momentum has picked up. He called attention to XRP’s bullish price position in relation to the significant 21 moving average. Notably, XRP recently broke above the 21 EMA on the monthly chart.
Resistance at the 21 EMA
When an asset’s price breaks above the 21 Exponential Moving Average, it typically indicates a short-term bullish signal, suggesting that the recent price trend is positive and may continue to rise in the near future.
XRP had continued to trade within the range of the 21-month EMA since June when it hit a high of $0.5658 and dropped from the high, closing the month at $0.4729. This decline stopped the asset from breaking above the significant EMA.
Additionally, its performances in subsequent months did not provide enough support for a comfortable breakout. Despite the surge to $0.9380 in July, XRP still found major resistance at the level. The correction that ensued also provided strength to the bears, keeping XRP at the 21 EMA level.
XRP Aims for $5.5 Amid Recent Break
However, the latest uptrend has helped XRP register a comfortable breakout above the EMA. XRP is up 19.5% since last month, riding on the ongoing market-wide bullishness. EGRAG confirmed that the recent break above the 21 EMA signals “robust bullish momentum.”
XRP 1M Chart | EGRAG Crypto
The analyst set price targets for XRP, as the uptrend continues. The first target rests on the July 20 high of $0.83. Should XRP overcome the resistance at this level, the next price target is $1.3. EGRAG noted that these are short term goals.
Once the asset conquers the $0.83 and $1.3 targets, it would set sail on a path to $2.8, according to the analyst. The last time XRP saw $2.8 was in January 2018 when it dropped from the all-time high of $3.31.
EGRAG’s analysis does not stop at $2.8, but projects a more ambitious target of $5.5 as the ultimate goal. XRP currently trades at $0.6150, up 0.65% over the last 24 hours. Reaching $5.5 would require a 794% increase, setting a new ATH.
The cryptocurrency market continues to experience some euphoric price moves from altcoins as Bitcoin remains the primary determinant and dictator of the market in recent weeks as price broke above key resistance of $32,000 to a high of $35,800 as many analysts, traders, and investors believe this could be the spark of a bull run.
The impending Bitcoin halving coming up in April of 2024 continues to be a talking point for many traders, investors, and analysts as there have been indications of the fundamentals and technical analysis of Bitcoin’s price action pointing to the big day that will usher in a time of bullish price action.
Speculations that Bitcoin spot ETF (Exchange-traded Fund) would be approved by December of 2023 or a few weeks before Bitcoin halving could spark more rally for this cryptocurrency asset as the highest market capitalization.
The cryptocurrency market hasn’t experienced such a green heat map for a while since the bear market began, as there have been more indications from the market and altcoin performance of the market experiencing a huge change in market sentiment.
This change in sentiment has led to the Bitcoin fear and greed indicator hitting over the 70% mark of green as the indicator suggests a minor pullback for prices including Bitcoin, Ethereum, and other weekly top 5 cryptos (XRP, SOL, BNB, ADA, MATIC).
A minor pullback for the cryptocurrency market is a healthy one as this would give room for higher price movement and weekly top 5 cryptos (XRP, SOL, BNB, ADA, MATIC) to perform better as some of these tokens continue to lag.
Although a minor pullback is possible, there has been high speculation of Bitcoin rallying higher than its present value as on-chain data continues to see a surge of activities on the Bitcoin network, suggesting bulls are dominating the market.
Bitcoin On Chain Analysis 5NOV23
Bitcoin’s (BTC) price action has experienced much on-chain activities in recent weeks after its price broke above key resistance and its yearly high of $32,000, creating a new yearly high of $35,800 as price gears up for more bullish price movement in the coming months.
With on-chain activities on the rise, the price of Bitcoin in recent weeks has rallied from a region of $26,600 to a high of $35,800 as the price of Bitcoin faces key resistance to break past $36,000.
A break and close above the region of $36,000 would mean well for the market as the price could rally higher to $40,000 to $48,000, where its price would be faced with much resistance as this area remains a supply area for higher timeframes.
With the Bitcoin fear and greed index still pointing at market greed of 68 points, it remains an interest if the price would rally high to a region of $40,000 to $48,000, considering how bullish the crypto market remains now.
After having the highest monthly close above the region of $34,400, the price of Bitcoin has continued to trade above its 50-day, 100-day, and 200-day Exponential Moving Averages (50-day, 100-day, and 200-day EMAs) for the first time after a long bearish price run as indicators including the Moving Average Convergence Divergence (MACD) all point to a bullish price action.
Despite Bitcoin’s impressive price action, Ethereum’s (ETH) price rally remains a huge concern for many traders and investors as the price of Ethereum has continued to remain underperforming for the past few weeks in the shadows of Bitcoin as price struggles to trade above $1,850.
The price of Ethereum has faced much price worry as the second largest cryptocurrency by market capitalization remains underperforming as its price struggles to clear $1,900 as this region remains key for higher price action.
If the price of Ethereum fails to close above $1,900, which could open the way for a price rally to $2,000, we could see Ethereum retrace back to its support of $1,780 holding price from going lower.
A higher price rally for Ethereum could mean well for altcoins and weekly top 5 cryptos (XRP, SOL, BNB, ADA, MATIC) performing better than expected, as the new week promises to be exciting for traders and investors looking to trade these tokens.
Ripple (XRP) Daily Price Chart as a Weekly Top 5 Cryptos to Watch
XRP USDT PRICE CHART 5NOV23
Ripple (XRP) has remained highly underperforming as it faced many struggles for dominance with the United States Security Exchange Commission (US SEC). It is believed its case with the US SEC has hampered its price growth fundamentally and technically.
Despite its struggles to be approved as a legal security for many traders and investors, Ripple’s on-chain data shows its dominance in the cryptocurrency market as it shows XRP/USDT maintains one of the highest activities. However, its price has struggled to replicate such trading activities.
After trading for weeks in a range of $0.47 to $0.55, the price of XRP/USDT currently trades above $0.6 as the price faces key resistance, which will be a determinant for the price of XRP/USDT trading higher than its current price.
The resistance of $0.65 for XRP/USDT corresponds to its 38.2% Fibonacci Retracement value (38.2% FIB Value) as the price of XRP/USDT needs to close above this point for its price to rally higher to a region of $0.9.
Ripple’s price action remains one of the most bullish charts in the cryptocurrency market on both higher and lower timeframes as its Relative Strength Index (RSI) and Moving Average Convergence Divergence (MACD) on the daily timeframe points to bullish momentum for XRP/USDT.
With many bullish sentiments and data pointing towards the growth of XRP/USDT, we could see one of the best performers in the coming bullish price rally for XRP/USDT, as the price could outperform many top crypto assets in the market.
Major XRP/USDT support zone – $0.55
Major XRP/USDT resistance zone – $0.65
MACD trend – Bullish
Solana (SOL) Price Chart Analysis on the Daily Timeframe
SOL USDT DAILY PRICE CHART 5NOV23
The price of Solana (SOL) was one of the best-performing cryptocurrency assets in the past weeks as the price rallied from a region of $14.5 to a high of $48 within a few weeks as there has been speculation of price rally higher as the next bull market approaches.
Solana has remained one of the top assets in the cryptocurrency market that has attracted investors and traders across the globe but suffered a hard deal during the crypto bear market as the price dropped from over $220 to a region of $10 associated with the collapse of FTX.
FTX were heavy investors of Solana as this great token possessed much potential and enabled scalability in the blockchain ecosystem but suffered many losses during the FTX fiasco, leading to a prolonged bearish price run for SOL/USDT.
Despite the US bankruptcy court granting permission to liquidate FTX assets, the price of SOL/USDT has demonstrated an incredible price action after closing above $32, which was its former yearly high as the price rallied to a high of $48 before suffering price decline as this region remains a supply zone for traders and investors.
The price of SOL/USDT currently trades above its 50-day EMA and 75% of its FIB value, highlighting much bullish price action for its price as the price of SOL/USDT could be looking to break above $50 to continue its price rally to $80 and possibly $100.
The region of $36.5, which corresponds to 61.8% FIB value, remains as key support for SOL/USDT as its MACD and RSI indicators point to more bullish price action for SOL/USDT.
Major SOL/USDT support zone – $36.5
Major SOL/USDT resistance zone – $50
MACD trend – Bullish
Binance Coin Price Analysis as a Top Cryptocurrency Asset
BNB USDT PRICE CHART 5NOV23
Binance Coin (BNB) has received its fair share of price loss in the bear market as the price of BNB/USDT dropped from its all-time high of $660 to a low of $200 as the price bounced from this area of demand to hold strong against a bearish sell-off.
Despite much FUD (fear, uncertainty, and doubt) surrounding BNB/USDT price, the price of BNB/USDT has found several ways of defending this region of $200 as bears would be looking at capitalizing at this region to push the price lower.
The price of BNB/USDT has remained dormant in recent weeks as many cryptocurrency altcoins rally with much price action. After forming a downtrend line, the price of BNB/USDT broke out of this downtrend, with the price currently facing resistance around $240.
The price of BNB/USDT must break above $240 convincingly to rally higher to a resistance of $275, corresponding to the 50% FIB value. If the price of BNB/USDT breaks and holds above $240, we could see a price rally to the next resistance.
The price of BNB/USDT is currently trading above the 50-day EMA as the price shows a change in trend from a bearish to a bullish trend in the past weeks, with its MACD and RSI all indicating a bullish price trend for BNB.
Major BNB/USDT support zone – $220
Major BNB/USDT resistance zone – $275
MACD trend – Bullish
Cardano (ADA) Price Chart Analysis on the Daily Timeframe
ADA USDT DAILY PRICE CHART
Cardano (ADA) remains one of the top cryptocurrencies in the market with a strong community, huge investors and traders backing this great project as many traders and investors believe it could be the next Ethereum killer.
The price action for Cardano (ADA) in recent times has been encouraging as there has been rumor of ADA holders being eligible for its Midnight Airdrop as holders and traders ask questions about becoming eligible as holders.
The price of ADA/USDT suffered a much price decline to a region of $0.24 as the price formed a strong support to hold-off sellers or bears from dominating price lower to its yearly low of $0.18 as the price bounced quickly to trade above its 50-day EMA.
After forming what looked like a double bottom on the daily timeframe, the price of ADA/USDT bounced from $0.24 to show strength, rallying to a high of $0.32 above its key support, corresponding to 38.2% of its FIB value.
With much bullish action as indicated by its MACD and RSI, the price of ADA/USDT is aiming to recapture the highs of $0.4 to a high of $0.45 as the bulls continue to show strength and much price dominance in the.
Major ADA/USDT support zone – $0.3
Major ADA/USDT resistance zone – $0.4-$0.45
MACD trend – Bullish
Polygon (MATIC) Price Analysis as a Weekly Top 5 Cryptos to Watch
MATIC USDT DAILY PRICE CHART 5NOV23
The current market rally has been good for Polygon (MATIC), which has remained inactive in its price movement as the price ranges around $0.5 to $0.56 for weeks as it has formed what looks like the bottom around $0.5.
Despite much euphoria of the cryptocurrency market returning to its busy times in recent weeks, the price of MATIC/USDT has shown little price action as this needs more volume to push the price of MATIC/USDT higher.
The price of MATIC/USDT could face its first strong resistance of $0.75, which corresponds to the 23.6% FIB value, as a break and close above this region could signal happy times ahead for many MATIC holders.
The price of MATIC/USDT currently trades above its 50-day EMA, corresponding to support of $0.6, as the price faces many tasks to reclaim higher regions for much bullish price action.
If the price of MATIC/USDT breaks above $1.1, it could mean bullish price action for bulls to push the price to a region of $1.5 and possibly $2.
MATIC’s MACD and RSI indicators show the price gradually building bullishness as the current price is accompanied by less volume to enable bulls to rally the price of MATIC/USDT higher.