Shiba Inu burn analytical resource Shibburn asserts that the all-time high (ATH) for SHIB could have halved to $0.00004225 if the historic burn from Ethereum founder Buterin never occurred.
The team behind Shibburn disclosed this in their latest analysis of Vitalik Buterin’s monumental burn exercise. A post from their official X account suggests that the token allotment did ultimately affect SHIB’s price movements in 2021.
Notably, the recent disclosure aimed to clarify an earlier statement on the impact of the event to Shiba Inu’s 2021 bull run. “What if Vitalik Buterin had sold the 50% of the $SHIB supply instead, or if the 50% had never been sent to him?”Shibburn asked in the tweet.
What if Vitalik Buterin had sold the 50% of the $SHIB supply instead, or if the 50% had never been sent to him? The price could have reached $0.00004225 when Market Cap was at its All-Time High instead of $0.00008845. If it had the same demand. #SupplyAndDemandpic.twitter.com/eCGTeotCFX
Recall that Shiba Inu’s anonymous founders allotted half of the token’s circulating supply to Buterin. Buterin donated 10% of the assets he received to charity and sent the remaining 90% to the burn address, effectively removing them from circulation.
Interestingly, this monumental burn from Buterin coincided with Shiba Inu’s impressive rally in 2021. However, SHIB had already kick-started the rally before the burn transaction occurred.
The 90% burned by Buterin amounted to 410 trillion tokens worth $7 billion at the time of the transaction. These tokens accounted for 41% of Shiba Inu’s circulating supply.
Shibburn believes allotting the tokens to Buterin already triggered a positive price reaction. This price reaction, compounded by a growing demand for Shiba Inu, catalyzed SHIB’s 2021 rally even before the burn transaction occurred.
Shiba Inu ATH Would Have Been $0.00004425
SHIB witnessed a meteoric rise that saw it appreciate at an astronomical rate. Interestingly, Vitalik Buterin’s burn transaction occurred after this meteoric rise. Nonetheless, after the burn, Shiba Inu soared once more. The asset eventually hit the ATH of $0.00008845 in October 2021.
At the $0.00008845 price, Shiba Inu reached a peak market cap of $42.25 billion in 2021. With this massive valuation, the asset secured a spot among the top 3 crypto assets.
According to Shibburn, if Buterin had not received 50% of the supply or if he had dumped the tokens on the market, Shiba Inu’s all-time high would have been $0.00004225. This value is half of the current ATH and would have been the price at which SHIB hit its peak market cap.
The disclosure from Shibburn underscores the impact of burns, investor sentiment, and demand on an asset’s price. The insights are especially useful for market participants, as they anticipate massive burns on Shibarium.
Bitcoin’s (BTC) trial to break out of its range has proven abortive for bulls as its rally in the early part of last week was cut short by bears when the price of Bitcoin saw its price drop from a high of $26,400 back to its price range of $25,700.
The price of Bitcoin’s inability to reclaim the highs of $26,500, which has become a minor resistance, continues to worry many traders and investors as the price of Bitcoin has failed to drop below its support of $25,300, raising concerns for bulls.
The price action for Bitcoin and other top-ranking cryptocurrencies like Ethereum have maintained low volume and less price action following Bitcoin remaining in huge price dominance by bears for the past month.
On-chain data shows the cryptocurrency market remains in less activity following Bitcoin’s low volume in activities except for some exceptional weekly top 5 cryptocurrencies that could rampage in the coming weeks.
Bitcoin has remained much under the influence of BTC bears for over a month now as the price of Bitcoin has failed to break past the high of $26,500 after the price of Bitcoin fell from its high of $29,500 to a low of $25,800.
The price of BTC currently trades below $26,000, suggesting the price of Bitcoin needs to break above the resistance of $26,500 for BTC bulls to push the price high to a region of $27,300 for a minor relief bounce to be possible.
Bitcoin’s price trading below the 50-day and 200-day Exponential Moving Averages (50-day and 200-day EMAs) signifies the bear-dominating price as the price would most likely continue in its downtrend if BTC bulls fail to reclaim the high of $26,500.
If the price of Bitcoin fails to hold above the minor support of $25,300, we could see the price pushed by BTC bears to a low of $24,000 to $23,500, acting as a demand zone for BTC price as bulls would look to defend this region and push price higher for a possible price recovery.
Bitcoin’s stalling in price has also had much effect on the like of Ethereum (ETH) as ETH has remained on a downward price movement for the past month, suggesting price has remained much under the influence of ETH bears.
After suffering rejection from a high of $2,000, the price of Ethereum has struggled to show real flame to the upside as Ethereum bears have dominated the price of Ethereum to the downside, giving ETH little or no room for price bounce to the upside.
If the price of ETH continues in its spiral downtrend, we could see the price retesting the lows of $1,550 to $1,500 before seeing a major price bounce to the upside as the price of Ethereum looks heavier to the downside than to the upside.
Despite the price of Bitcoin and Ethereum suffering much price decline, the cryptocurrency market has seen some great crypto tokens showing many signs of a potential price rally in recent weeks, with CYBER, PERP, and others rallying by over 300% within a week.
This has highlighted the need to pay attention to these weekly top 5 cryptocurrencies (SOL, LTC, XRP, SHIB, DOGE) and areas of interest for many traders and investors before their major moves to an upside or downside, depending on their price actions.
Solana (SOL) Price Analysis as a Weekly Top 5 Cryptocurrency to Watch
SOL USDT PRICE CHART 1D
Solana (SOL) has remained a key figure in the cryptocurrency industry despite facing many controversies in the present crypto bear market. The price has dropped below expectation for many traders and investors.
Despite its price drop, Solana (SOL) remains a top 5 cryptocurrency token many traders and investors always have in their portfolio for a long-run price gain. Let us dive deep into its price analysis and performance ahead of the coming bull market.
The price of SOL/USDT after finding strong support around a low of $14.5, the price of SOL/USDT bounced from this region as bulls pushed the price to a high of $31.5, acting as strong resistance for the price of SOL/USDT.
Solana’s price failed to break above this region of $31.5 as bears rejected the price to $26.2. The price of SOL/USDT has tried to reclaim the high of $31.5 as the price has failed to maintain a downward price trend as bears continue to push prices lower.
SOL/USDT has shown much strength in previous weeks, holding above $21 as the price faced a key decision to resist bears from pushing its price lower as the bulls failed to defend this key region for the price of SOL/USDT.
The price of SOL/USDT currently trades below $20 as the price looks weak in a bearish downtrend trading below the 50-day EMA, acting as resistance for the price of SOL/USDT from breaking above.
Solana’s bull needs to defend the price from breaking below the 23.6% Fibonacci Retracement value (23.6% FIB Value); else, we could see SOL’s bears pushing the price lower to a low of $14, possibly $12.
The Moving Average Convergence Divergence (MACD) for SOL/USDT on the daily timeframe shows bears maintaining their bearish price trend. Its Relative Strength Index (RSI) indicates low buy volume as bears stay in control.
If the price of SOL/USDT reclaims above $19, it would be good for bulls; a break below this region could signify a downtrend for SOL/USDT price.
Major SOL/USDT support zone – $19
Major SOL/USDT resistance zone – $23
MACD trend – Bearish
Litecoin (LTC) Price Analysis on the Daily (1D) Timeframe
LTC USDT PRICE ANALYSIS 1D CHART
The price of LItecoin (LTC) saw so much on-chain rise before its halving in August as the price of LTC/USDT rallied from its yearly low of $43 to a high of $115 as its price compensated for its halving hype acting as a huge catalyst for this top 5 cryptocurrency.
Leading to its halving, the price of LTC/USDT saw its price drop from its high of $115 to a low of $88 as many traders and investors suggested the price could rally to $165 as its minor price decline was to give opportunities to late buyers.
The price of LTC/USDT has continued to struggle to hold key regions of support after its halving as the price has continued its downtrend price movement that has seen the price trade lower than its support of $75.
The MACD and RSI for LTC/USDT on the daily timeframe suggest the price of LTC/USDT could bounce to a high of $70 if the crypto market produces a relief bounce.
LTC/USDT needs to hold above $65 to avoid retesting $50 support, acting as a good demand zone for the price of LTC/USDT. If the price of LTC/USDT is above $65, it could be a good sign for bulls.
Major LTC/USDT support zone – $65-$55
Major LTC/USDT resistance zone – $75
MACD trend – Bullish
Dogecoin (DOGE) Price Analysis as a Top 5 Cryptocurrency to Watch
DOGE USDT PRICE CHART
The price of Dogecoin (DOGE) has gone under the radar for the past few weeks despite many speculations of X (formerly Twitter) using this cryptocurrency as a mode of payment, as Elon remains a huge admirer of DOGE.
Dogecoin’s (DOGE) price has struggled to replicate the rally that has earned it this much fame and glory as the crypto market continues to be a huge challenge for the likes of DOGE/USDT as the price has remained in a downtrend for weeks.
The price of DOGE/USDT currently trades above the key area of interest of $0.055 for many traders and investors as the price of DOGE/USDT has respected this region on previous price decline down to this region.
If the price of DOGE/USDT loses this support of $0.055, we could have the price retest its yearly low of $0.045, which would seem extreme for the price to be that low for now.
The price of DOGE needs to reclaim above $0.075 before bulls would have much advantage to push the price higher as it continues to trade below its 50-day EMA, indicating many advantages for bears to push the price lower to $0.055.
Dogecoin MACD and RSI indicate bearish price dominance for the price of DOGE; bulls need to rescue the price of DOGE for these indicators to change from bearish to bullish as the price looks much more likely for $0.055.
Major DOGE/USDT support zone – $0.055
Major DOGE/USDT resistance zone – $0.067
MACD trend – Bearish
Ripple (XRP) Daily (1D) Timeframe Price Analysis
XRP USDT PRICE CHART
Ripple (XRP) continues to gain much popularity after its success in its US lawsuit as on-change data suggest many activities going on for this token, with a recent list on Kleverswap suggesting it’s just a matter of time before price compensates for such on-chain activities for XRP/USDT.
The price of XRP/USDT has remained in a downtrend after a few days of rallying to a high of $0.93 as many speculated the price of XRP/USDT to trend higher above $1 as the price failed to reach the expectations of many.
XRP/USDT has been in a range price movement for weeks now; a breakout from this range movement could see the price of XRP/USDT rally high or low in the direction of its breakout.
The price of XRP/USDT needs to hold above $0.45, acting as strong support for the price as the price has held well above this region. A breakout for XRP/USDT to the upside of $0.57 could see the price reclaim above $0.6, acting as resistance for the price as the price could aim to trend higher.
Ripple’s price trades below its daily 50-day EMA, suggesting a much bearish hold on price as its daily MACD and RSI indicate bears continue to show much dominance on the price of this token.
A breakout from its range movement for the price of XRP/USDT would be huge for either bulls or bears as the direction would determine XRP’s movement.
Major XRP/USDT support zone – $0.45
Major XRP/USDT resistance zone – $0.57
Shiba Inu (SHIB) Price Analysis as a Top 5 Crypto Asset
SHIB USDT 1D PRICE CHART
Despite its Shibarium hype, many tipped SHIB/USDT price to rally high considering how much hype Shibarium mainnet has generated, as many believe this could be a huge catalyst for SHIB price to a new yearly high.
The price of SHIB/USDT has remained less motivating with its price action as the price of SHIB/USDT rallied to a high of $0.00001100 before suffering a price decline to $0.00000750 as SHIB army attempts to hold off bears from pushing the price of SHIB lower.
The price of SHIB needs to hold above the 38.2% FIB value and reclaim its price above the 50-day EMA for the price to resume its bullish rally to a high of $0.00001200 or higher. If the price of SHIB fails to reclaim its price above $0.00000850, which corresponds to the 50-day EMA, we could see the price maintain a bearish downtrend.
SHIB’s price will retest the low of $0.00000660 if the price maintains a bearish price decline, as this region has proven to hold on several occasions against huge sell-offs.
Ripple’s CTO expresses excitement that XLS-30 AMM is now available for voting on the mainnet.
In a recent tweet, Ripple’s Chief Technology Officer David Schwartz revealed one of his most cherished XRP Ledger (XRPL) features.
The revelation came after the RippleX development team disclosed the proposal amendment for XLS-30 Automated Market Maker (AMM) on the XRPLedger. The team added that the amendment has become available for voting.
In response, Schwartz excitedly remarked that his favorite XRPL feature —XLS-30 AMM— has become available for voting on the mainnet.
While XRP community members asked, the Ripple CTO did not clarify what made the XLS-30 AMM one of his favorites for XRPL.
XLS-30 AMM Voting on Mainnet
According to the RippleX development team, XLS-30 is a pioneering protocol marking the first AMM built natively into the XRPLedger. For context, AMMs are decentralized exchanges (DEXs) that allow market participants to trade digital assets without traditional order books.
Instead, it uses smart contracts and liquidity pools to enable peer-to-peer token swaps. Users earn fees after providing liquidity to the pools.
In the announcement, the team noted that the amendments to the XRPL-based AMM are currently being reviewed and voted on by the validator community. The voting process is a step towards its integration into the XRPL Mainnet.
The team stated that XLS-30 would synergize the native AMM operations to enable seamless crypto trading within liquidity pools on XRPL. Per the update, one of the core amendments to XLS-30 was the addition of a novel Continuous Auction Mechanism.
According to the team, the feature incentivizes arbitrageurs to actively bid on mispricing opportunities. Moreover, the attribute is expected to mitigate the effects of impermanent loss for liquidity providers effectively.
Furthermore, the RippleX development team claimed that the combination of the unique features of XLS-30 alongside XRPL’s trademark low fees and rapid transaction finality places the AMM at the forefront of DeFi innovation.
Klever Wallet adds XRP to its swap service, enabling users to exchange it with BTC, ETH, BNB, USDT, USDC, and TUSD.
XRP, the only digital asset with regulatory clarity in the United States, has gained additional support from a prominent blockchain solution firm.
In a recent tweet, digital asset management platform Klever Wallet announced its extra support for XRP. According to the announcement, XRP has become available on KleverSwap. It implies that XRP is now swappable against the various pairs supported on the platform.
Notably, the swap service requires no registration or signups. The notification cited trading pairs crypto market participants can exchange XRP on the swap Klever platform.
In particular, Klever Wallet mentioned users can now pair XRP with Bitcoin (BTC), Ethereum (ETH), and Binance Coin (BNB). Moreover, XRP is pairable with stablecoins Tether USD (USDT), Circle USD (USDC), and True USD (TUSD).
The XRP community reacted positively to the announcement, with many considering it a welcoming development.
It is worth mentioning that Klever Wallet supported the buying, sending, receiving, and storing of XRP before the announcement. The non-custodial solution also supports over 10,000 cryptocurrencies. Moreover, the firm supports the XRP network in its hardware wallet solution, KleverSafe.
Other Cryptos on Klever
Meanwhile, in another announcement, Klever Wallet spotlighted other cryptocurrencies recently added to the coin swap service. It has included BTC and ETH wrapped on the Tron blockchain.
Also, the recently included digital assets from the Ethereum blockchain are ApeCoin (APE), wrapped Bitcoin, TUSD, DAI stablecoin, and Decentraland (MANA). MANA is a digital asset for purchasing and trading virtual lands.
Notably, existing coins supported for KleverSwap include Shiba Inu (SHIB), Pepecoin (PEPE), Dogecoin (DOGE), Litecoin (LTC), PancakeSwap token (CAKE). Klever Wallet has urged the crypto community to be on the lookout as they add more cryptocurrencies to KleverSwap.
The number of Shiba Inu addresses holding at least $1 million worth of SHIB has plummeted by a massive 67% to 393 over the past three months.
Shiba Inu (SHIB) has slipped into the crossfire between the bears and the bulls. Amid this impediment, addresses holding at least $1 million worth of SHIB have dropped by 67% to 393 since June.
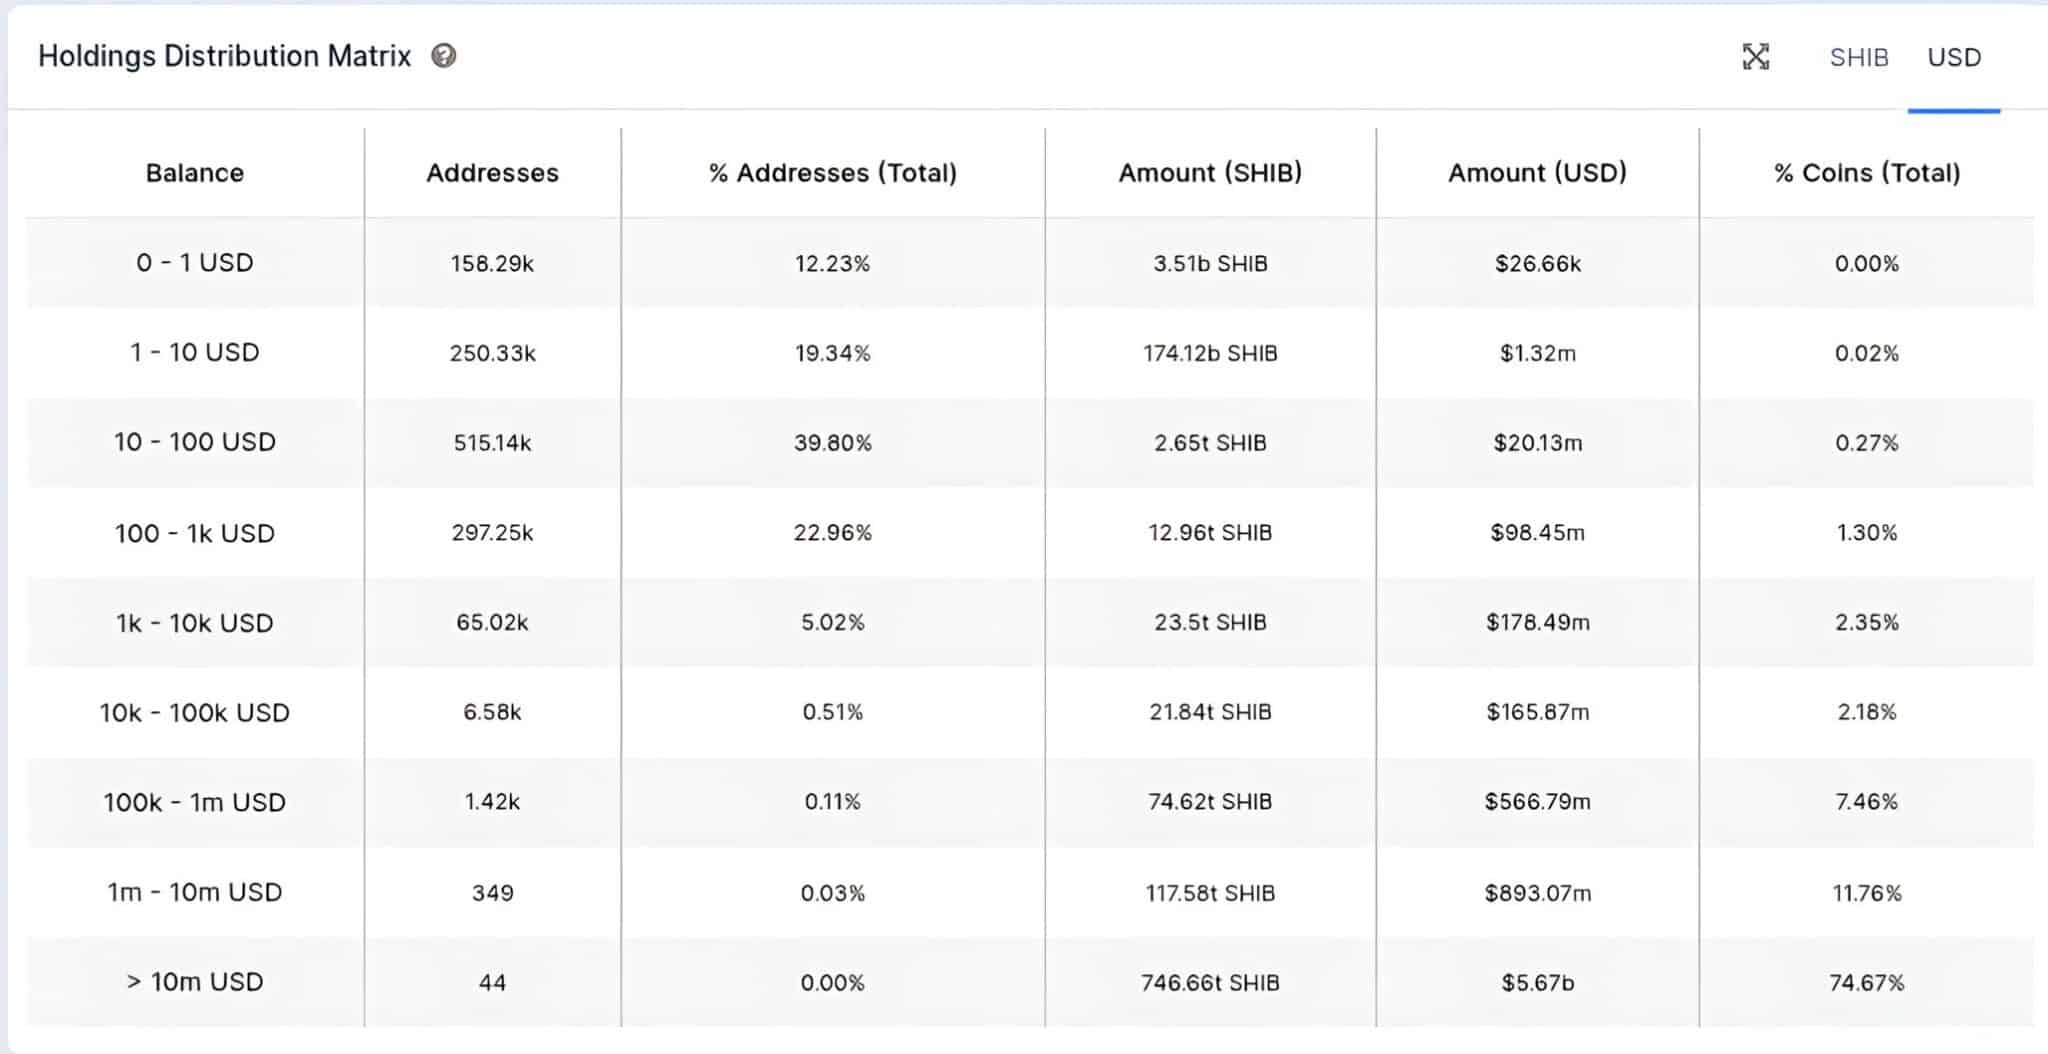
According to data from on-chain intelligence resource IntoTheBlock, Shiba Inu addresses with balances valued at $1 million or above now stand at 393. This is a massive 67% drop from the 1,207 figure reported by The Crypto Basic in June.
Shiba Inu Holders | IntoTheBlock
Among these addresses, those holding between $1 million and $10 million worth of SHIB have dropped to 349. This class of addresses collectively holds 117.58 trillion Shiba Inu. Their cumulative holdings are currently worth $893 million as of press time.
Interestingly, the number of wallets holding between $1 million and $10 million worth of SHIB stood at 1,150 as of the previous report on June 8. This indicates that this class of holders lost 801 addresses in three months.
Furthermore, wallets holding SHIB worth more than $10 million have also declined, albeit at a more modest rate. These wallets now amount to 44, down 22% from the 57 reported in June. This drop suggests that this holder category has lost 13 wallets since June.
Shiba Inu Sees Large Holder Inflow
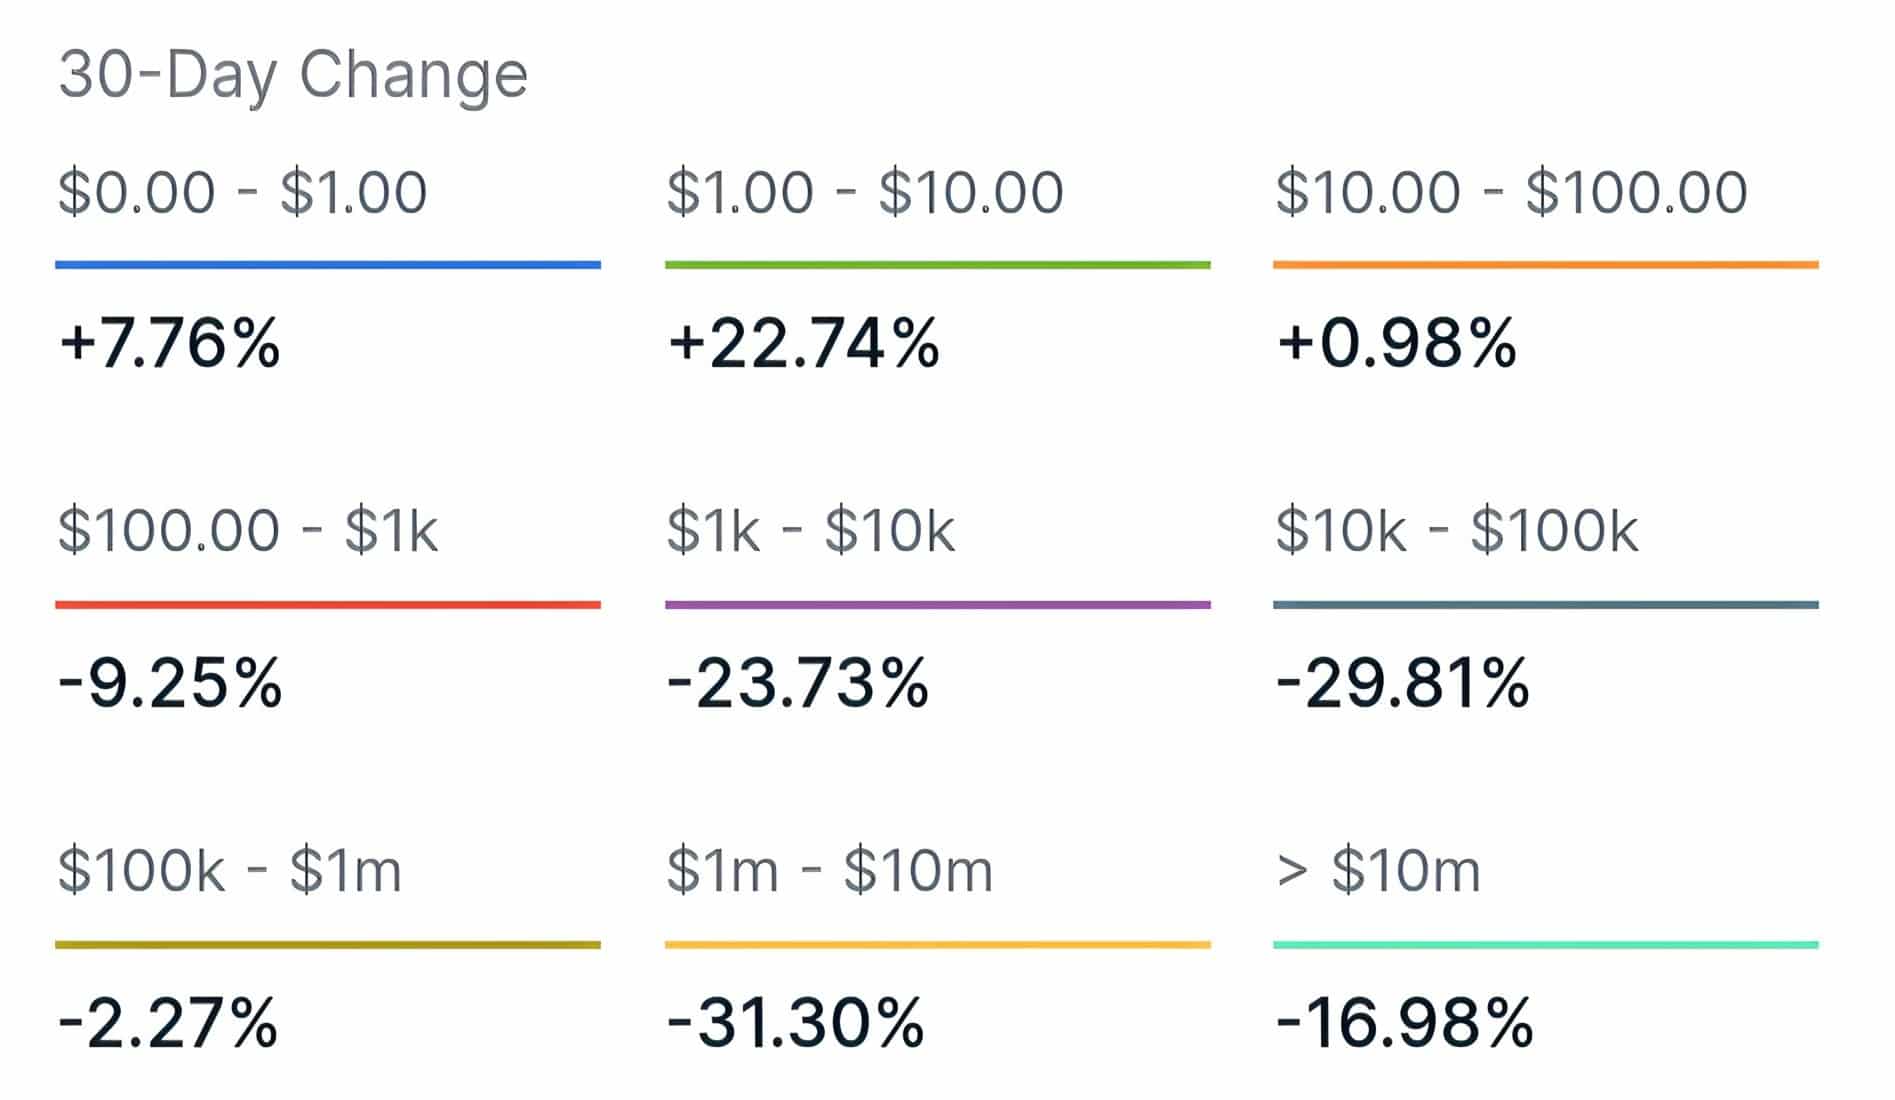
Notably, IntoTheBlock data also highlights the 30-day change of these addresses. The data corroborates the growing decline in their numbers, with addresses holding between $1 million and $10 million, dropping by 31.30% over the last 30 days.
Shiba Inu Addresses 30-Day Change | IntoTheBlock
In addition, wallets holding above $10 million have decreased by 16.98% in the past 30 days. These declines cut across multiple holder categories, affecting all classes of addresses holding at least $100. Conversely, addresses between $1 and $10 saw a 22.74% increase.
The drop in Shiba Inu millionaires could stem from the recent decline in SHIB’s price. Another factor that could have compounded this drop is a trend of selloffs triggered by waning investor confidence.
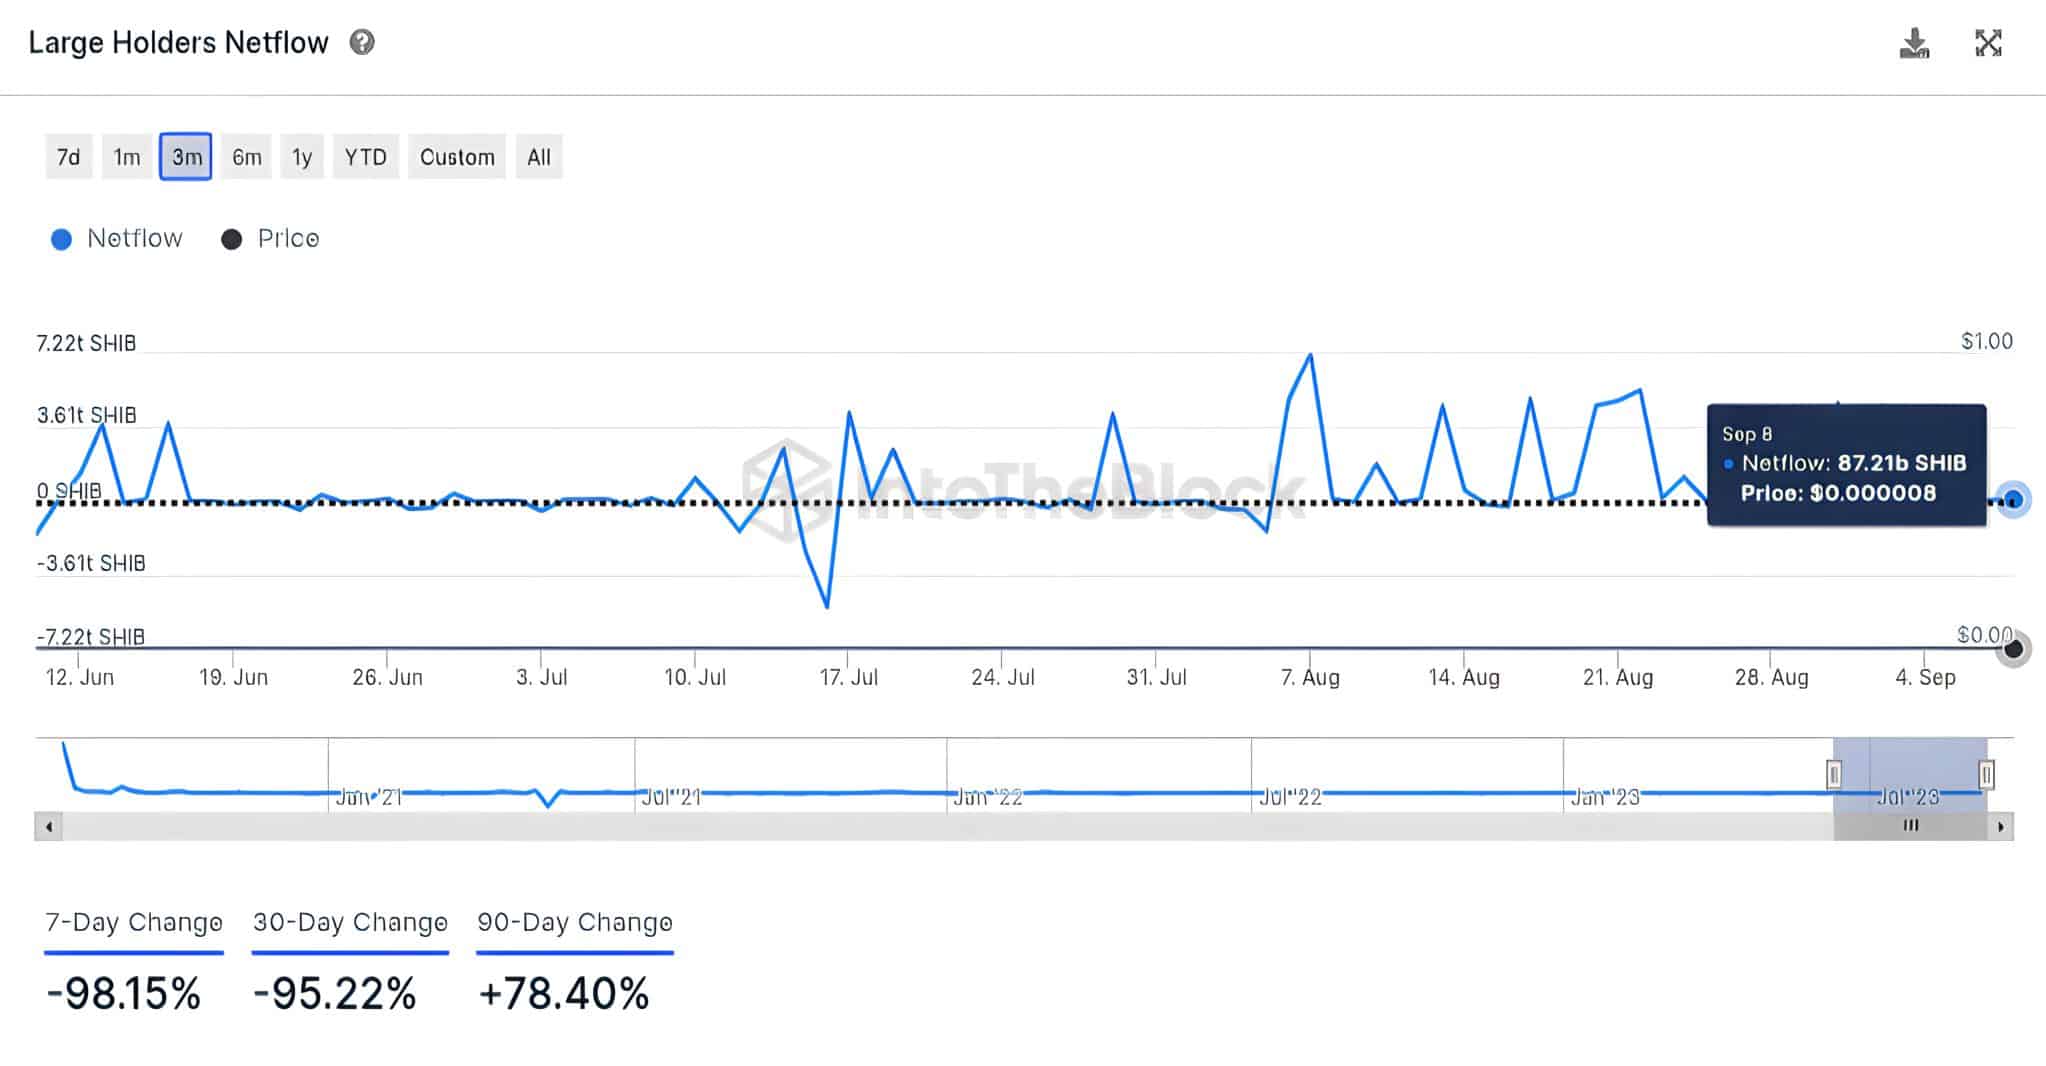
Interestingly, Shiba Inu has witnessed a positive large holder netflow over the past three months, with a 78% increase.
Shiba Inu Large Holder Netflow | IntoTheBlock
This impressive influx of large holders comes amid market turbulence and the declining rate of millionaire addresses. Meanwhile, Shiba Inu is currently trading for $0.00000762, up 1.06% over the past 24 hours.
According to Bard, SHIB’s price could likely be volatile this month, fluctuating between the levels of $0.000007 and $0.000009. It revealed that some experts project a potential price ascent for SHIB to around $0.00001 by September 2023 if there is a positive sentiment in the market.
Conversely, others speculate that SHIB could plunge to $0.000006 if the bear market continues.
SHIB October Price Prediction
Per Bard, market analysts expect SHIB to trade between $0.0000089 and $0.0000116 by the end of October 2023. The chatbot highlighted four factors that could help SHIB surge to $0.0000116. They include a bullish market, increased whale activity, widespread adoption, and the rollout of new products by the Shiba Inu team.
“Overall, the price of SHIB in October 2023 is likely to be volatile. However, if the coin can maintain its current momentum, it could reach new highs,” Bard added.
SHIB November 2023 Price Outlook
For November 2023, Bard projected SHIB’s average price to be around $0.0000095. It added that some experts expect the 16th-largest cryptocurrency to range between $0.0000092 and $0.0000115.
Per Google’s AI chatbot, SHIB’s November price will be determined by the forces of demand and supply.
“Ultimately, the price of SHIB in November 2023 will depend on the overall demand and supply for the token. If there is more demand than supply, the price will go up. If there is more supply than demand, the price will go down,” the chatbot added.
Bard Projection for SHIB in December 2023
According to Bard, experts project SHIB to reach an average price of $0.00001038 by the year end. On the other hand, some analysts are more bearish in their predictions, as they expect SHIB to plummet to around $0.00000605 by the end of December 2023.
Meanwhile, Bard urged investors to be cautious despite its recent forecasts, as crypto assets are highly volatile. At the time of writing, SHIB was changing hands at $0.00000762, down 22% over the past 30 days.
Wall Street financial expert Linda Jones recently shared with the crypto community how non-accredited investors can buy shares of Ripple before the firm’s eventual public offering.
In a recent post, Jones noted that Linqto has unveiled a special package for people who could not pass the accredited investor requirement to invest in Ripple stock. The offer is called ‘Reg D.’ The sole aim is to allow non-accredited investors to acquire Ripple shares pre-IPO.
#Ad NON-accredited Investors…BIG NEWS! If you want to invest in Ripple stock (private equity) before the IPO but you don't meet the requirements for an Accredited Investor, Linqto has a special offer for you! They put together a Reg D offering which will allow non-accredited… pic.twitter.com/oePuqXDo0H
According to the update, the Linqto offering commences next week, particularly on Monday or Wednesday. The intending buyers of Ripple shares are to prepare a minimum investment of $2,500.
The first step involves registering an account on the Linqto platform. For the next step, Jones stated that intending buyers should move their funds to the Uphold platform and store the amount in US dollars. The minimum amount transferable through Uphold to Linqto is $2,500 a day via debit and credit cards, as well as Apple and Google Pay. The maximum daily limit is $10,000 if you are funding your Uphold via ACH.
After the fund movement, Jones stated that Linqto would verify such a user. The third step includes transferring the $2,500 from Uphold into Linqto via the Linqto software.
It is worth mentioning that the essence of sending the fund to Uphold before subsequently sending it to Linqto is to expedite the process of fund confirmation. Interested persons not pleased with such multiple steps can directly send from their bank accounts to Linqto.
However, Jones highlighted that the process may take up to three days before the beneficiary’s account is credited.
Regardless, for the fourth step, the interested individuals are to watch the Linqto app or their email for a message on Monday. The last timeline for the email message is Wednesday, September 13.
By that date, the Ripple stock will be available for acquisition. While the option for wire transfer to Linqto is also available, Jones cautioned that the stock could sell out before the fund confirmation.
Not Financial Advice
Meanwhile, the Wall Street expert disclaimed that the announcement does not constitute financial advice. She urged participants to assess their risk tolerance level properly before proceeding.
Shiba Inu’s L2 blockchain Shibarium records a massive spike in activity.
Shiba Inu’s Layer-2 blockchain Shibarium has been recording impressive stats since its public relaunch. The L2 blockchain has continued to witness an astounding growth in user activity.
Shibarium Transactions Surpass 1.5M
Notably, the total transaction count on Shibarium recently surpassed 1.5 million. According to data from Shibariumscan, the network’s total transactions now stand at 1,535,852 (1.53 million).
The development comes less than 24 hours after The Crypto Basic reported that Shibarium’s total transactions stood at 1.36 million. Interestingly, the total transactions on Shibarium have spiked by 12.14% in 24 hours to 1.53 million.
Furthermore, Shibarium’s interacting wallet addresses have also surged above 1.12 million. At press time, a total of 1,120,095 addresses have already interacted with Shibarium.
Number of BONE Staked Surpass 26M
Meanwhile, the number of Bone ShibaSwap (BONE), Shiba Inu’s governance token, staked on Shibarium has skyrocketed above 26 million.
At the time of writing this line, there are currently 26,131,323.8906 (26.13 million) BONE staked on the L2 protocol, equivalent to $24.46M.
Notably, these BONE tokens are staked across 12 validators, with Unification ranked as the top validator on Shibarium.
Per data from the Shibarium Staking platform, Unification leads as the top validator with a staked amount of 5,393,005 (5.39 million) BONE tokens.
Unification is closely followed by ShibArmy Africa and ShibArmy America, which hold 4,035,725 (4.03M) and 3,717,727 (3.71 million) BONES, respectively.
Other Shibarium validators and their BONE holdings include ShibArmy Europe; 3,240,096 (3.24M), ShibArmy Oceania; 2,105,506 (2.1M), ShibArmy Asia; 2,024,822 (2.02M), and Ryoshi Labs; 1,990,572 (1.99M).
In addition, Shib of the Round Table holds 979,386 BONES, Burn Baby Burn; 921,255, Dojo; 786,447, 42069 validator; 557,891 BONE, while Chainmasters holds 378,885 BONES.
It bears mentioning that these validators are responsible for validating transactions on the Shibarium network.
Google’s experimental AI chatbot Bard recently made several projections on the timeline for Shiba Inu to hit $0.001, $0.01, and $0.1.
Google’s AI chatbot, Bard, has generated a series of projections regarding the future price milestones of Shiba Inu (SHIB). Notably, Bard recently presented projected timelines for Shiba Inu to hit $0.001, $0.01 and $0.1
$0.001
Shiba Inu proponents eyeing the $0.001 mark should prepare for a patient journey. Bard suggests it could take until 2024 or even 2025 for SHIB to hit this milestone. Currently priced at $0.00000759, achieving $0.001 implies an astronomical 13,075% surge.
$0.01
Reaching the $0.01 mark is an even more formidable task, requiring a massive 131,652% surge from the current price.
Bard is cautious, deeming it unlikely in the next few years. However, the chatbot speculates that, with increasing popularity and adoption, SHIB might touch $0.01 by 2033.
$0.1
For Shiba Inu to scale to $0.1, it would need an astonishing 1,317,423% rally. This would require the asset to replicate the previous meteoric surge it registered between 2020 and 2021.
This would catapult SHIB’s market cap to a staggering $58.9 trillion, assuming the circulating supply remains relatively stable. To put this in perspective, the entire crypto market’s cap currently stands at $1.04 trillion.
While this goal may seem far-fetched, Bard suggests that if SHIB can establish itself as one of the premier crypto assets globally, the $0.1 summit might be attainable in the coming decades.
However, Bard noted that it is vital to approach these projections with caution. The cryptocurrency market is notorious for its unpredictability, and multiple factors can influence SHIB’s price.
According to the AI chatbot, some of the variables that could sway SHIB’s price trajectory include:
New Use Cases: If SHIB finds adoption as a payment method by major businesses, it could increase its price.
Market Performance: A bullish overall cryptocurrency market might provide tailwinds for SHIB.
Greater Demand: Heightened demand for SHIB could skyrocket the asset’s price. The recently launched L2 solution Shibarium aims to attract investors to the Shiba Inu ecosystem.
Negative News: Conversely, negative developments like security breaches or escalating FUD could lead to price declines.
Bard emphasized that investors must remain cautious despite the recent projections. The crypto market is characterized by volatility and unpredictability. As a result, the journey to $0.001, $0.01, or $0.1 remains uncertain, with numerous variables at play.
Meanwhile, Shiba Inu has not escaped the recent market decline, plummeting harder than most assets. SHIB is down 21% over the past 30 days, as it changes hands at $0.00000759 as of press time.
XRP has sustained an upward trajectory on its yearly chart, with a 48% appreciation this year despite the recent setbacks on shorter timeframes.
The market-wide turmoil has not spared XRP, as the asset has forfeited the gains picked up on July 13. However, despite this setback, XRP maintains an upward trajectory on the yearly chart, with a 48% increase this year.
XRP community figure Alex Cobb first called attention to this reality amid the waning bullish sentiments. Cobb shared a chart detailing XRP’s yearly price movements from 2013 to 2023.
A zoomed-out view of XRP’s yearly performance over the past decade reveals an impressive growth exhibited by the asset. The view unveils an upward trajectory for XRP since January 2013.
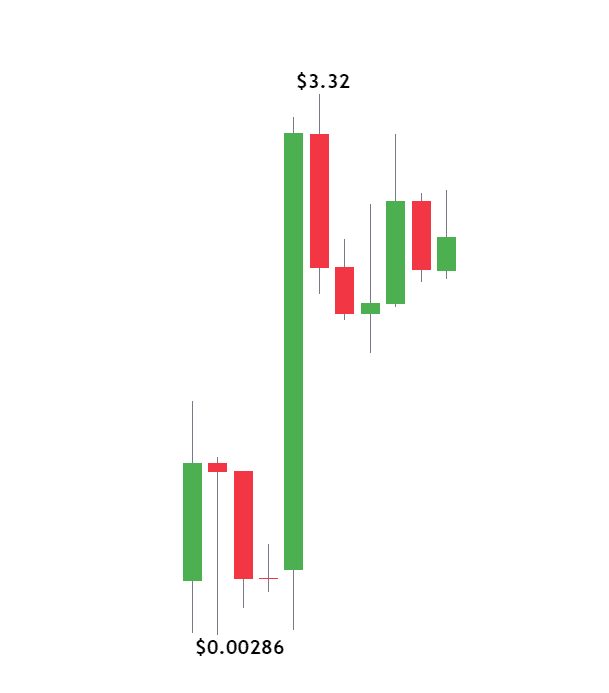
XRP Yearly Chart | Alex Cobb
Notably, XRP closed 2013 with a massive 366% gain. However, the asset faced a correction over the next three years, shedding over 86% of its value from 2014 to 2016. However, XRP sustained some of the gains of 2013.
XRP’s breakthrough period came up in 2017 when it surged by an astronomical 33,000% rate. XRP eventually closed 2017 at $1.9900, having begun the year at $0.0067. The asset built on the 2017 rally to hit the $3.32 ATH in January 2018.
Nonetheless, following these bullish performances, XRP started facing fluctuations. An attempt to register a new ATH during the bull market of 2021 met opposition due to the legal pressure from the SEC lawsuit.
XRP Up 48% This Year
Despite the impediment, XRP sustained a momentum to the upside. The asset’s recent upsurge has complemented this momentum. Remarkably, XRP is up 48% since January 1, 2023, securing a spot among the biggest gainers this year.
XRP outperforms other prominent crypto assets such as Ethereum (ETH), Cardano (ADA), BNB (BNB), and Dogecoin (DOGE). For context, ETH sees a 36% gain this year, while ADA is only up 3.5%. BNB and DOGE are down 12% and 9% this year.
This outlook is significant because it details XRP’s bullish momentum when zoomed out. The recent correction from the $0.9380 high has damaged investor confidence. Cobb’s disclosure aims to strengthen optimism in XRP’s long-term prospects.
Upon observing the yearly chart, another XRP community figure asserted that the asset is on the verge of a rally. In response, Cobb agreed with this sentiment. XRP is currently trading for $0.5041, up 1.27% over the past week.