Home Blog Page 408

Will Ethereum Momentum Shift to Bulls as Market Wipes Off $25M in Shorts?

Ethereum shows early signs of recovery as $25 million in shorts get liquidated, signaling bullish momentum may be building.

Ethereum (ETH) is attempting a mild rebound after recent downside pressure, with the price hovering around $2,912.14 at press time, up roughly 1.6% over the past 24 hours. The intraday range between $2,862.84 and $2,973.89 shows buyers repeatedly testing the upper band but still struggling to reclaim the $3,000 psychological level. 

Zooming out, however, the broader picture remains cautious. Ethereum is still down about 5.5% over the past week, 16% in the last 14 days, and more than 30% on the 30-day view. Against this backdrop, the next sections will unpack Ethereum’s key technical levels, trend structure, and potential catalysts that could decide whether this bounce evolves into a more meaningful recovery.

Next Resistance for Ethereum Price

Specifically, on the technical front, Ethereum’s daily chart built around Bollinger Bands shows the token trying to recover from sustained downside pressure. On November 21, price pierced and rode the lower band near $2,629, signaling an oversold phase, before bouncing back inside the bands and toward the midline, which currently sits around $3,129. 

Screenshot 2025 11 26T122659918
Ethereum

This reversion move suggests sellers are losing some control, but the bands still slope downward, underscoring that the broader trend remains corrective. A clean daily close above the middle band would be an important first step in reducing volatility, shifting momentum back in favor of buyers and opening room toward the upper band near $3,644. That move would require Ethereum to jump about 25% from the current $2,912.

Interestingly, momentum signals from the Stochastic RSI back up this early recovery narrative. After spending time in the oversold zone, the Stoch RSI lines have turned sharply higher, with the blue line now at 86.8 and the signal line following at 60.97, reflecting a strong swing in short-term bullish momentum. However, readings in or near the overbought region also warn that upside could cool if Ethereum fails to clear nearby resistance. 

Ethereum Liquidation Data

Backing up the technical picture, derivatives data show that Ethereum is in the middle of a leverage reset as both bulls and bears are being “rekt” at different time frames. Over the past hour, about $1.80 million in positions were liquidated, almost entirely from longs, with only around $3,000 in shorts closed. 

Screenshot 2025 11 26T123915287
Coinglass

The 4-hour window tells a similar story, with $3.43 million in total liquidations dominated by roughly $3.36 million in long positions versus just $69,000 in shorts. 

However, when zooming out, the balance shifts. In the last 12 hours, Ethereum has seen $18.93 million in liquidations split between approximately $7.41 million in longs and $11.52 million in shorts, while the 24-hour tally rises to $54.19 million, with $25.64 million wiped from longs and $28.55 million from shorts. Notably, the shorts are currently bearing most losses, signaling a market skewed towards upside.
Analyst Shares XRP Secret Weapon That Could Power $15.5 Trillion

0

Brad Kimes, creator of Digital Perspectives, has called the XRP Ledger’s built-in decentralized exchange (DEX) its “secret weapon.”

His remarks come as Ripple expands its institutional presence and developers revisit the core features that set the XRPL apart from other blockchains.

Specifically, Kimes pointed out that with Hidden Road handling $3 trillion and GTreasury $12.5 trillion in annual transactions, over $15.5 trillion in financial activity could soon flow through the XRPL. 

He called it a crucial moment as the crypto industry pushes for the market structure bill set to pass in 2026.

“Don’t believe it? It’s still true,” he added, noting that the XRPL is built to handle this scale of institutional settlement.

Brad Kimes comments
Brad Kimes comments

Ripple’s Multi-Chain Vision and the Expanding Role of XRP

A recently resurfaced video of Ripple president Monica Long added further context. Long reiterated that Ripple has always believed in a multi-chain, multi-token world, where different assets serve different roles depending on the use case.

She explained that XRP will always retain utility as the native asset of the XRP Ledger, powering gas fees and reserve accounts. She noted that demand for the token will rise as the network sees increased use from developers and institutional clients.

Long also highlighted a unique advantage few outside the community fully appreciate: the XRPL’s original DEX.“

Built into the ledger from the start, the DEX automatically routes trades that lack direct liquidity through XRP.

According to Long, this “auto-bridging” is where XRP becomes a true bridge asset, independent of Ripple’s payment products and relevant across any developer-driven use case.

The XRPL DEX, Hidden Road, and GTreasury

The resurgence of interest in the XRPL DEX follows Ripple’s rapid institutional expansion. Earlier this year, Ripple confirmed that Hidden Road’s entire post-trade infrastructure will transition to the XRP Ledger.

GTreasury, a major player in global corporate financial operations for over four decades, would serve as Ripple’s entry point into the $120 trillion corporate treasury sector.

While not all of this volume will convert to direct XRP usage, analysts are paying attention to how XRPL features like automated market-making, auto-bridging, and native settlement could handle high-volume operations.

Crypto Eri previously clarified that post-trade activity on the XRP Ledger will involve the movement of RLUSD collateral, settlement flows, and possibly data-related functions such as reconciliation.

Why it Matters for XRP

Notably, Long pointed out that Ripple’s payment system still uses both XRP and stablecoins for efficiency. Meanwhile, commentators are focusing on XRP’s role as a liquidity asset in the XRPL DEX.

As more projects build on the XRPL and connect to other blockchains, demand for XRP could grow as a routing asset. In other words, XRP’s advantage is not just speed or low fees alone but the XRPL’s underlying design. 

As Ripple targets institutional finance, the DEX could become a key part of digital asset infrastructure.

Based on this, analysts have been modeling various scenarios for what all of this could mean for XRP’s long-term market price.

Santiment Says XRP Still Slightly Undervalued Despite Market Recovery

0

Despite the recent rebound in the broader crypto market, XRP shows a slight undervaluation, according to Santiment. 

Following a prolonged market downturn, many cryptocurrencies, including XRP, are now attempting to recover. XRP, which briefly slipped to $1.83 during the decline, has since climbed back above $2 level. 

XRP Is the Least Undervalued Among Major Cryptos 

Despite this rebound, blockchain analytics platform Santiment notes in its latest assessment that several major crypto assets remain undervalued, including XRP.

Using the 30-day MVRV ratio, which measures the average purchase price of coins held by active wallets over the past month compared to the current price, Santiment found that XRP has experienced only a slight decline over the past month.

According to the data, XRP wallets show an average 30-day return of -4.7%, placing the asset in the “Very Slight Undervaluation” zone.

This is notably less severe than the conditions for other assets such as Cardano and Chainlink, which fall into the “Extreme Undervaluation” (-19.2%) and “Strong Undervaluation” (-13.0%) zones, respectively.

By comparison, Ethereum and Bitcoin show “Mild Undervaluation” at -6.3% and -6.1%, respectively. 

Image

Potential Rebound? 

As the least undervalued asset in the group, XRP has spared recent investors from severe losses, showing milder downside pressure.

Although the metric indicates that investors who bought XRP in the past 30 days are still experiencing slight losses, it also suggests potential buying opportunities. In a previous analysis, Santiment noted that assets with a negative MVRV ratio are more likely to stage a rebound than those with a positive ratio.

Meanwhile, XRP was trading at around $2.15 at the time of the analysis. At this price, the Crypto Basic reported that 36.70% of XRP’s total supply, or 22.1 billion tokens, were in the red. 

Notably, XRP has rebounded from the $2.15 level and currently trades at $2.20. It has surged 1.2% over the past day and 1.95% over the past week. However, it is still down in the 30-day timeframe, with its losses standing at 16.43%. 

Analyst Shares What to Expect as Shiba Inu Defends Yearly Low

0

Shiba Inu has continued to hold above a key long-term support level, sparking optimism of a resurgence targeting higher prices.

Despite recent correctional price actions, Shiba Inu (SHIB) has shown resilience around critical price levels. The second-largest meme coin by market cap has dropped by double digits over the past 30 days while also losing nearly 60% of its value at the start of the year.

Key Shiba Inu Support Holds

Yet, it has held above a long-term support area, a TradingView analysis from “The Alchemist Trader” highlighted. The market commentator emphasized that SHIB is holding above a yearly price low of $0.00000734.

Shiba Inu dropped to $0.00000678 on Binance during the October 10 market crash but quickly recovered to close much higher. Since then, the token has failed to break below the $0.00000734 demand zone, recording several candle closes above the level despite obvious price weakness.

The analyst highlighted that this emphasizes the area’s strength while also suggesting price stabilization. According to him, these are prerequisites for a recovery push for the prominent meme coin.

Further bolstering optimism is the recent surge in network activity. For instance, The Crypto Basic reported an 859% surge in Shiba Inu burn rate a few days back, as the ploy to create scarcity of the SHIB token intensifies. The market watcher considers this bullish for the token, asserting it could support a reversal.

What to Expect from SHIB

Meanwhile, the Alchemist Trader predicted that if the $0.00000734 yearly low continues to hold, SHIB could plot a recovery to higher prices. An accompanying chart shows a possible rebound towards the first target of $0.00001591. From the current market price of $0.00000858, this represents an 85% price increase.

Shiba Inu Holds Key Support Level

Notably, the region aligns closely with the July high, an area SHIB has faced severe opposition in the past. The token failed to sustainably trend above the area during May’s lower high, reestablishing the strong sell pressure there.

Remarkably, analyst Crypto Feras also shares a similar target. He predicted in a parallel commentary that SHIB is ready for a breakout towards $0.000001546. 

If SHIB manages to defy this area, it will now target a 178% increase from the current market price to $0.0000239. Notably, Shiba Inu last changed hands at such a high in January, when it peaked at $0.0000249.

Bitcoin Defends Macro Floor with Upside Scenario Eyeing $180K

Bitcoin holds key Fibonacci support as signs of recovery appear and an analyst eyes a move to new all-time highs.

Renewed optimism around potential Federal Reserve rate cuts is lighting a hopeful spark for Bitcoin price recovery. Notably, Bitcoin’s price, currently at $87,729, reflects a period of consolidation in the past few hours, following a peak of $89,209 on Monday this week. The daily price range has fluctuated between $86,215 and $88,097, indicating a relatively tight trading range within the past 24 hours.

Looking at the performance over the longer term, Bitcoin’s price has dropped by 3.5% over the past week, and 15.1% over the last 14 days. The performance indicators point to a cautious outlook for the short-term. Will Bitcoin test and breach crucial resistance for another leg up?

Bitcoin Price Analysis

On the technical end, Bitcoin’s latest daily chart shows the asset attempting to stabilize with a modest rebound from the $80,559 local low from November 21. Price is now trading near $87,794, sitting in the mid-zone of its current range and testing early signs of recovery.

Screenshot 2025 11 26T110739974
Bitcoin

The Fibonacci retracement levels outline clear resistance zones ahead: BTC remains below the 0.236 level at $89,013, while the 0.382 ($94,243), 0.5 ($98,470), and 0.618 ($102,697) levels represent major barriers the bulls must reclaim to confirm a broader trend reversal. Until then, the market remains in a corrective structure, but the tightening range suggests momentum is shifting from aggressive selling to cautious accumulation.

Notably, a decisive break above the 0.236 Fib level could open the door for a recovery toward $94,000 and $98,000. Conversely, failure to hold above the mid-range could expose the $82,000–$80,500 support area again.

The Awesome Oscillator (AO) reinforces this shift by showing a gradual decline in bearish momentum. After printing deep red bars throughout most of November, the indicator is now turning lighter and beginning to produce green bars. This is typically an early bullish signal.

Bitcoin Repeats 2021 Bear Setup

Elsewhere, a latest analysis from Merlijn The Trader highlights a striking resemblance between Bitcoin’s current market structure and the 2021 bear market setup. In 2021, BTC failed to hold a key horizontal support level and broke below its descending trendline, triggering a prolonged downturn.

Image

Today’s chart shows Bitcoin testing a similar structure, with price once again pressing against a major macro support zone, this time around $82,000. However, unlike in 2021 when the breakdown confirmed a deeper bear cycle, BTC has bounced off this level.

According to Merlijn, this successful defense of the $82K base is the key differentiator that could flip the entire market bullish if price manages to break above the prevailing downtrend line. The analyst places his target at $180,000 if the formation plays out. This would represent a 105% increase from the current price.

Teucrium CEO Says XRP is a Modern JPMorgan Rival

0

XRP is at the center of an effort by fintech giant Ripple to create an ecosystem that rivals top financial institutions like JPMorgan.

Teucrium CEO Sal Gilbertie is bullish on Ripple, expressing his confidence in what the XRP ecosystem is building. In a recent interview with top pundit Paul Baron, the CEO boldly claimed that Ripple is on track to compete with the apex companies of the traditional banking system.

Teucrium CEO Calls Ripple a “Machine”

Gilbertie called Ripple a “machine” and a “highly disciplined team” focused on driving mainstream adoption of its blockchain-focused payment innovation. Furthermore, he stated that the firm is developing technology that would compete with JPMorgan, an international financial services provider with over $4.6 trillion in assets under management (AUM).

While JPMorgan offers banking and wealth management services, it also facilitates inter- and intra-border settlements. Data shows that the bank processes nearly $10 trillion in payments daily across over 160 countries, and Ripple wants a share of this impressive volume.

Notably, Ripple is progressing in this course intentionally, and the Teucrium CEO acknowledged that. He noted that this JPMorgan rivalry will intensify when Ripple obtains its banking license.

“They are gonna be incredibly well capitalized,” he added, expanding on the impact of the banking charters on Ripple’s operation.

Notably, the San Francisco-based company filed for a US banking license with the Office of the Comptroller of the Currency (OCC) in July. Once approved, it would grant Ripple the right to provide fiduciary services, including custody of its RLUSD stablecoin.

Ripple Has No Reason to Sell XRP

For context, Gilbertie’s statement follows a question from host Barron whether Ripple CEO Brad Garlinghouse’s statement on XRP’s sales settled the market. For context, there have been community concerns over the Ripple team’s XRP sales. 

Some have also highlighted perceived negligence of XRP following recent Ripple expansions. However, Garlinghouse has assured that XRP is at the center of Ripple’s plans. 

Notably, the Teucrium CEO shared that Ripple has no reason to sell its XRP stash. “Why would they want to sell XRP?” he asked, concluding that they would hold on to the asset.

However, he does expect some level of sales. Gilbertie noted that the Ripple team might sell some of their holdings as the asset appreciates.

So, the CEO concluded that Garlinghouse’s statement that XRP is at the center of Ripple’s plan was a modest take. According to him, Ripple is at the “center of the universe.”

Remarkably, this is not the first time Gilbertie has praised Ripple and XRP. He claimed in August that Ripple could “hopefully” replace SWIFT, building on his earlier comments that XRP has massive utility and demand.

Expert Predicts What High Prices XRP Could Reach as ETFs Trigger Supply Shock

0

XRP analyst Chad Steingraber has offered a new perspective on the ongoing XRP ETF supply discussion.

He suggests that the question is no longer whether XRP price will rise, but how high it needs to go to slow institutional buying. His latest model examines ETF inflows and estimates the “average price” XRP may need as asset managers continue accumulating.

New Formula for the ETF Era

Steingraber says that forecasting XRP’s future value requires looking at its average price across different market growth stages, rather than focusing on a single target.

In a conservative scenario with $33.6 billion in annual institutional inflows, ETF issuers could quickly absorb XRP if prices remain low.

Currently, ETF demand is soaring. Steingraber argues that only a rising price can naturally slow how fast asset managers accumulate XRP. In his model, price acts as a throttle controlling supply.

For context, XRP ETFs now manage $644 million in assets, achieved in just eight trading days. Notably, ETFs contributing to this XRP acquisition include Canary Capital, Bitwise, Grayscale, and Franklin Templeton.

How XRP Price Levels Affect Supply Absorption

Steingraber’s projection outlines how many XRP units would need to be purchased per year, depending on price growth:

If XRP reaches $11.25 (a 5X increase from today’s price), ETFs could buy nearly 3 billion XRP annually.

A 10X surge to $22.5 could reduce the number to roughly 1.49 billion.

At $45 per XRP, annual demand would shrink to around 746 million; at $90, to just over 373 million; and at $225 (a 100X increase), to fewer than 150 million XRP in a full year.

High Price targets of XRP New111
High Price targets of XRP

In essence, Steingraber suggests that if ETF inflows remain strong, XRP’s price cannot remain flat. The higher the inflows, the higher the price must climb to prevent asset managers from rapidly consuming the entire public supply.

Conversely, if prices remain low, ETFs could absorb all of XRP’s supply very quickly.

ETF Demand Puts XRP Under Pressure

Steingraber’s model reinforces his earlier warning: XRP faces only two outcomes in the ETF era. Either ETFs accumulate most of the circulating supply at current prices, or rising prices slow their buying.

His “One-Day Billion” scenario showed that twelve ETFs could demand over a billion dollars’ worth of XRP per day under aggressive assumptions.

Even now, demand is significant. Canary Capital’s XRPC ETF raised $245 million on day one and has reached $329 million so far.

Bitwise has secured $168 million in XRP. Franklin and Grayscale have attracted about $150 million two days after launch, with three more issuers planning spot XRP products.

Earlier estimates suggest that seven ETFs alone could bring $7–$10 billion annually.

Delayed Price Reaction

Despite these inflows, XRP trades quietly near $2. XRPL Foundation Board Director Fabio Marzella notes that most issuers buy XRP via OTC desks, keeping early demand off public exchanges.

Coupled with Bitcoin’s dip below $100K, XRP’s price has remained muted. However, Steingraber’s models predict that rising ETF inflows and tightening supply will soon disrupt this calm.

Cardano Founder Blames Institutions for Latest Crypto Meltdown, Says ‘They Got What They Wanted’

0

Cardano founder Charles Hoskinson identifies institutions as the real cause of the recent crypto market crash. 

Throughout this month, the prices of major cryptocurrencies, including Bitcoin and Cardano, have been in steep decline. Cardano, for instance, opened November at $0.6092 but tumbled to a multi-month low of $0.3911 last week, leaving many investors frustrated. Likewise, Bitcoin, which reached $126,000 a month ago, dropped to $80,600 last week.

Institutions’ Pump-and-Dump Scheme Crashed Crypto Prices 

Speaking during a November 24 livestream, Cardano founder Charles Hoskinson delivered a blunt take on the recent crypto market slump. He argued that large institutions were the fundamental drivers of the downturn, accusing them of pumping and then dumping their digital asset treasuries (DATs). 

He claimed that major players, including firms like Citadel, “got what they wanted” by driving prices up, then shorting the market as it fell, profiting on both ends of the trade. According to him, these institutions pulled “tens of billions of dollars” out of the market through cycles of aggressive speculation. 

As a result, market makers were squeezed, retail investors suffered losses, and the market has been struggling ever since. He suggested that the combination of dominance by a few greedy institutions and widespread leverage left the market vulnerable when the bubble finally burst. 

Retail Participants Didn’t Learn from 2021 Bull Run 

Hoskinson argued that such behavior has become standard in the crypto market, where institutions extract “greedy money” while retail investors bear heavy losses. He emphasized that many have not learned the lessons of the 2021 bull run.

Notably, he described the 2021 bull run as a period marked by “irrational exuberance,” when highly speculative NFTs fetched millions of dollars, and valuations across the sector became detached from reality. 

This led to high-profile collapses such as FTX and LUNA, severely damaging public trust, wiping out everyday investors, and further eroding confidence in the ecosystem. 

Hoskinson Anticipates Major Rebound 

Meanwhile, the market is gradually showing signs of recovery. Cardano has climbed back above the $0.40 level, currently trading at $0.4206. Bitcoin has also rebounded, rising to $87,755, representing an 8.79% increase from its recent low of $80,659.

Although conditions remain uncertain, Hoskinson believes stability will return once the U.S. enacts the Clarity Act next year. He argues that the landmark legislation could boost investor confidence and accelerate crypto adoption, even suggesting that Bitcoin could reach $250,000 by the end of 2026. 

JPMorgan Recognizes Crypto as a Tradable Macro Asset

0

JPMorgan, which oversees roughly $5 trillion in client assets, says that cryptocurrencies are entering a new phase as institutional liquidity reshapes the market. 

In a recent research note, the bank argued that crypto is evolving into a tradable macro asset, moving beyond its roots in retail speculation and early-stage venture dynamics.

Institutional Liquidity Redefines Price Behavior

According to JPMorgan, the crypto market has shifted from its early model, where large private funding rounds set valuations long before public trading. Retail investors often entered late and absorbed most of the risk. Today, analysts observe a decline in retail activity alongside growing institutional participation.

“This shift is stabilizing flows, lowering volatility, and creating more reliable long-term pricing,” the report said. 

However, the bank also cautioned that market inefficiencies persist: liquidity remains uneven, contributing to sharp price swings. Macroeconomic conditions now play a greater role in crypto prices than Bitcoin’s traditional halving cycle, analysts added.

Consequently, JPMorgan estimates that Bitcoin could eventually reach $240,000, framing the asset as a multi-year growth play.

JPMorgan Research Note

JPMorgan Warns of MicroStrategy Delisting Risk

The research note surfaced shortly after JPMorgan warned that MicroStrategy (now Strategy) could be removed from major equity indices. The warning specifically mentioned the MSCI USA Index, citing the company’s vast Bitcoin holdings.

In particular, Strategy owns 649,870 BTC, worth $56.91 billion, making its balance sheet heavily dependent on a single asset. Its stock has fallen 40% in the past month, bringing its valuation close to the value of its Bitcoin holdings.

JPMorgan noted that the company’s narrow balance-sheet structure limits its ability to raise capital. Additionally, the bank highlighted a potential MSCI rule change that could exclude firms with more than half their assets in digital currencies.

JPMorgan Expands Its Own Bitcoin ETF Position

Despite its caution regarding MicroStrategy, JPMorgan has been expanding its own crypto exposure.

For instance, in a recent 13F filing, the bank disclosed holdings of 5,284,190 shares of BlackRock’s Bitcoin ETF, IBIT, worth $343 million as of September 30, representing a 64% increase from June.

The filing also revealed $68 million in call options and $133 million in put options linked to the ETF. These positions are spread across multiple business units, including those that serve high-net-worth clients.

Bitcoin Seen as Undervalued After October Sell-Off

JPMorgan analysts stated that Bitcoin currently trades at a discount relative to gold, following a 30% price drop in October from its recent all-time high of $126 000. This decline came after heavy futures liquidations and concerns stemming from a $128 million Balancer hack.

Analyst Nikolaos Panigirtzoglou noted that leverage in perpetual futures has since normalized. The bank added that gold’s surge above $4,000 per ounce brought higher volatility, while Bitcoin’s volatility eased.

On a risk-adjusted basis, JPMorgan estimates Bitcoin would need to reach roughly $170,000 to match gold’s private-sector investment value, suggesting meaningful upside over the next six to twelve months if current conditions persist.

Meanwhile, JPMorgan is also preparing to allow institutional clients to use Bitcoin directly as collateral for loans by the end of 2025. The bank currently accepts only crypto-linked ETFs. The expansion signals rising comfort with direct digital-asset exposure within regulated lending frameworks.

Here’s How Much XRP Supply is in Loss as XRP Trades at $2.15

0

Recent on-chain analysis from Glassnode has revealed the current rate of XRP and Bitcoin supply in the red.

Glassnode, a prominent digital asset analytical platform, released these recent statistics in an X post as the crypto market shows resilience. Bitcoin has held above $87,000, while altcoins have seen mixed price movements.

XRP Holder Profitability Sees Boost

The Glassnode tweet highlighted the profitability rates of some of the top cryptocurrencies by market cap to holders. It started off with the sector’s leader, Bitcoin, stating that 34.91% of its supply is at a loss.

Notably, BTC has a circulating supply of 19.95 million, according to CoinMarketCap, accounting for over 95% of the asset’s max supply. Notably, the Glassnode report shows that, of this figure, 6.96 million bitcoins are currently held at an unrealized loss. Consequently, a larger portion, about 65.09% of Bitcoin’s supply, is in profit, representing approximately 12.98 million BTC.

Meanwhile, about 36.70% of XRP’s supply is in the red. With its current circulating supply of 60.25 billion, this suggests that 22.1 billion tokens are unprofitable to holders at the present market standing.

Remarkably, an earlier report, barely a week ago, showed that 41.5% of the XRP supply is in the red, a figure last seen when prices trended at $0.50. At the time of this report, XRP changed hands at $2.15.

Its slight growth to $2.18 at press time has reduced this number, ensuring that 63.3% of XRP holders now have unrealized gains.

Large Chunk of Solana Supply in Loss

Glassnode also highlighted the rate of Solana and Ethereum supply in loss. Specifically, 38.37% of Ethereum’s 120.69 million circulating supply is in the red, with the other 61.63% (74.38 million ETH) held at unrealized gains.

Solana has the largest supply in loss among the listed cryptocurrencies. Notably, a staggering 74.84% of its circulating supply is unprofitable to holders, accounting for 418.55 million of its 559.26 million supply.

Notably, this suggests that most holders bought Solana either around the 2021 top or between last year and now. It also shows they ignored the token during the FTX implosion, which saw SOL capsize to $11 before the rebound.

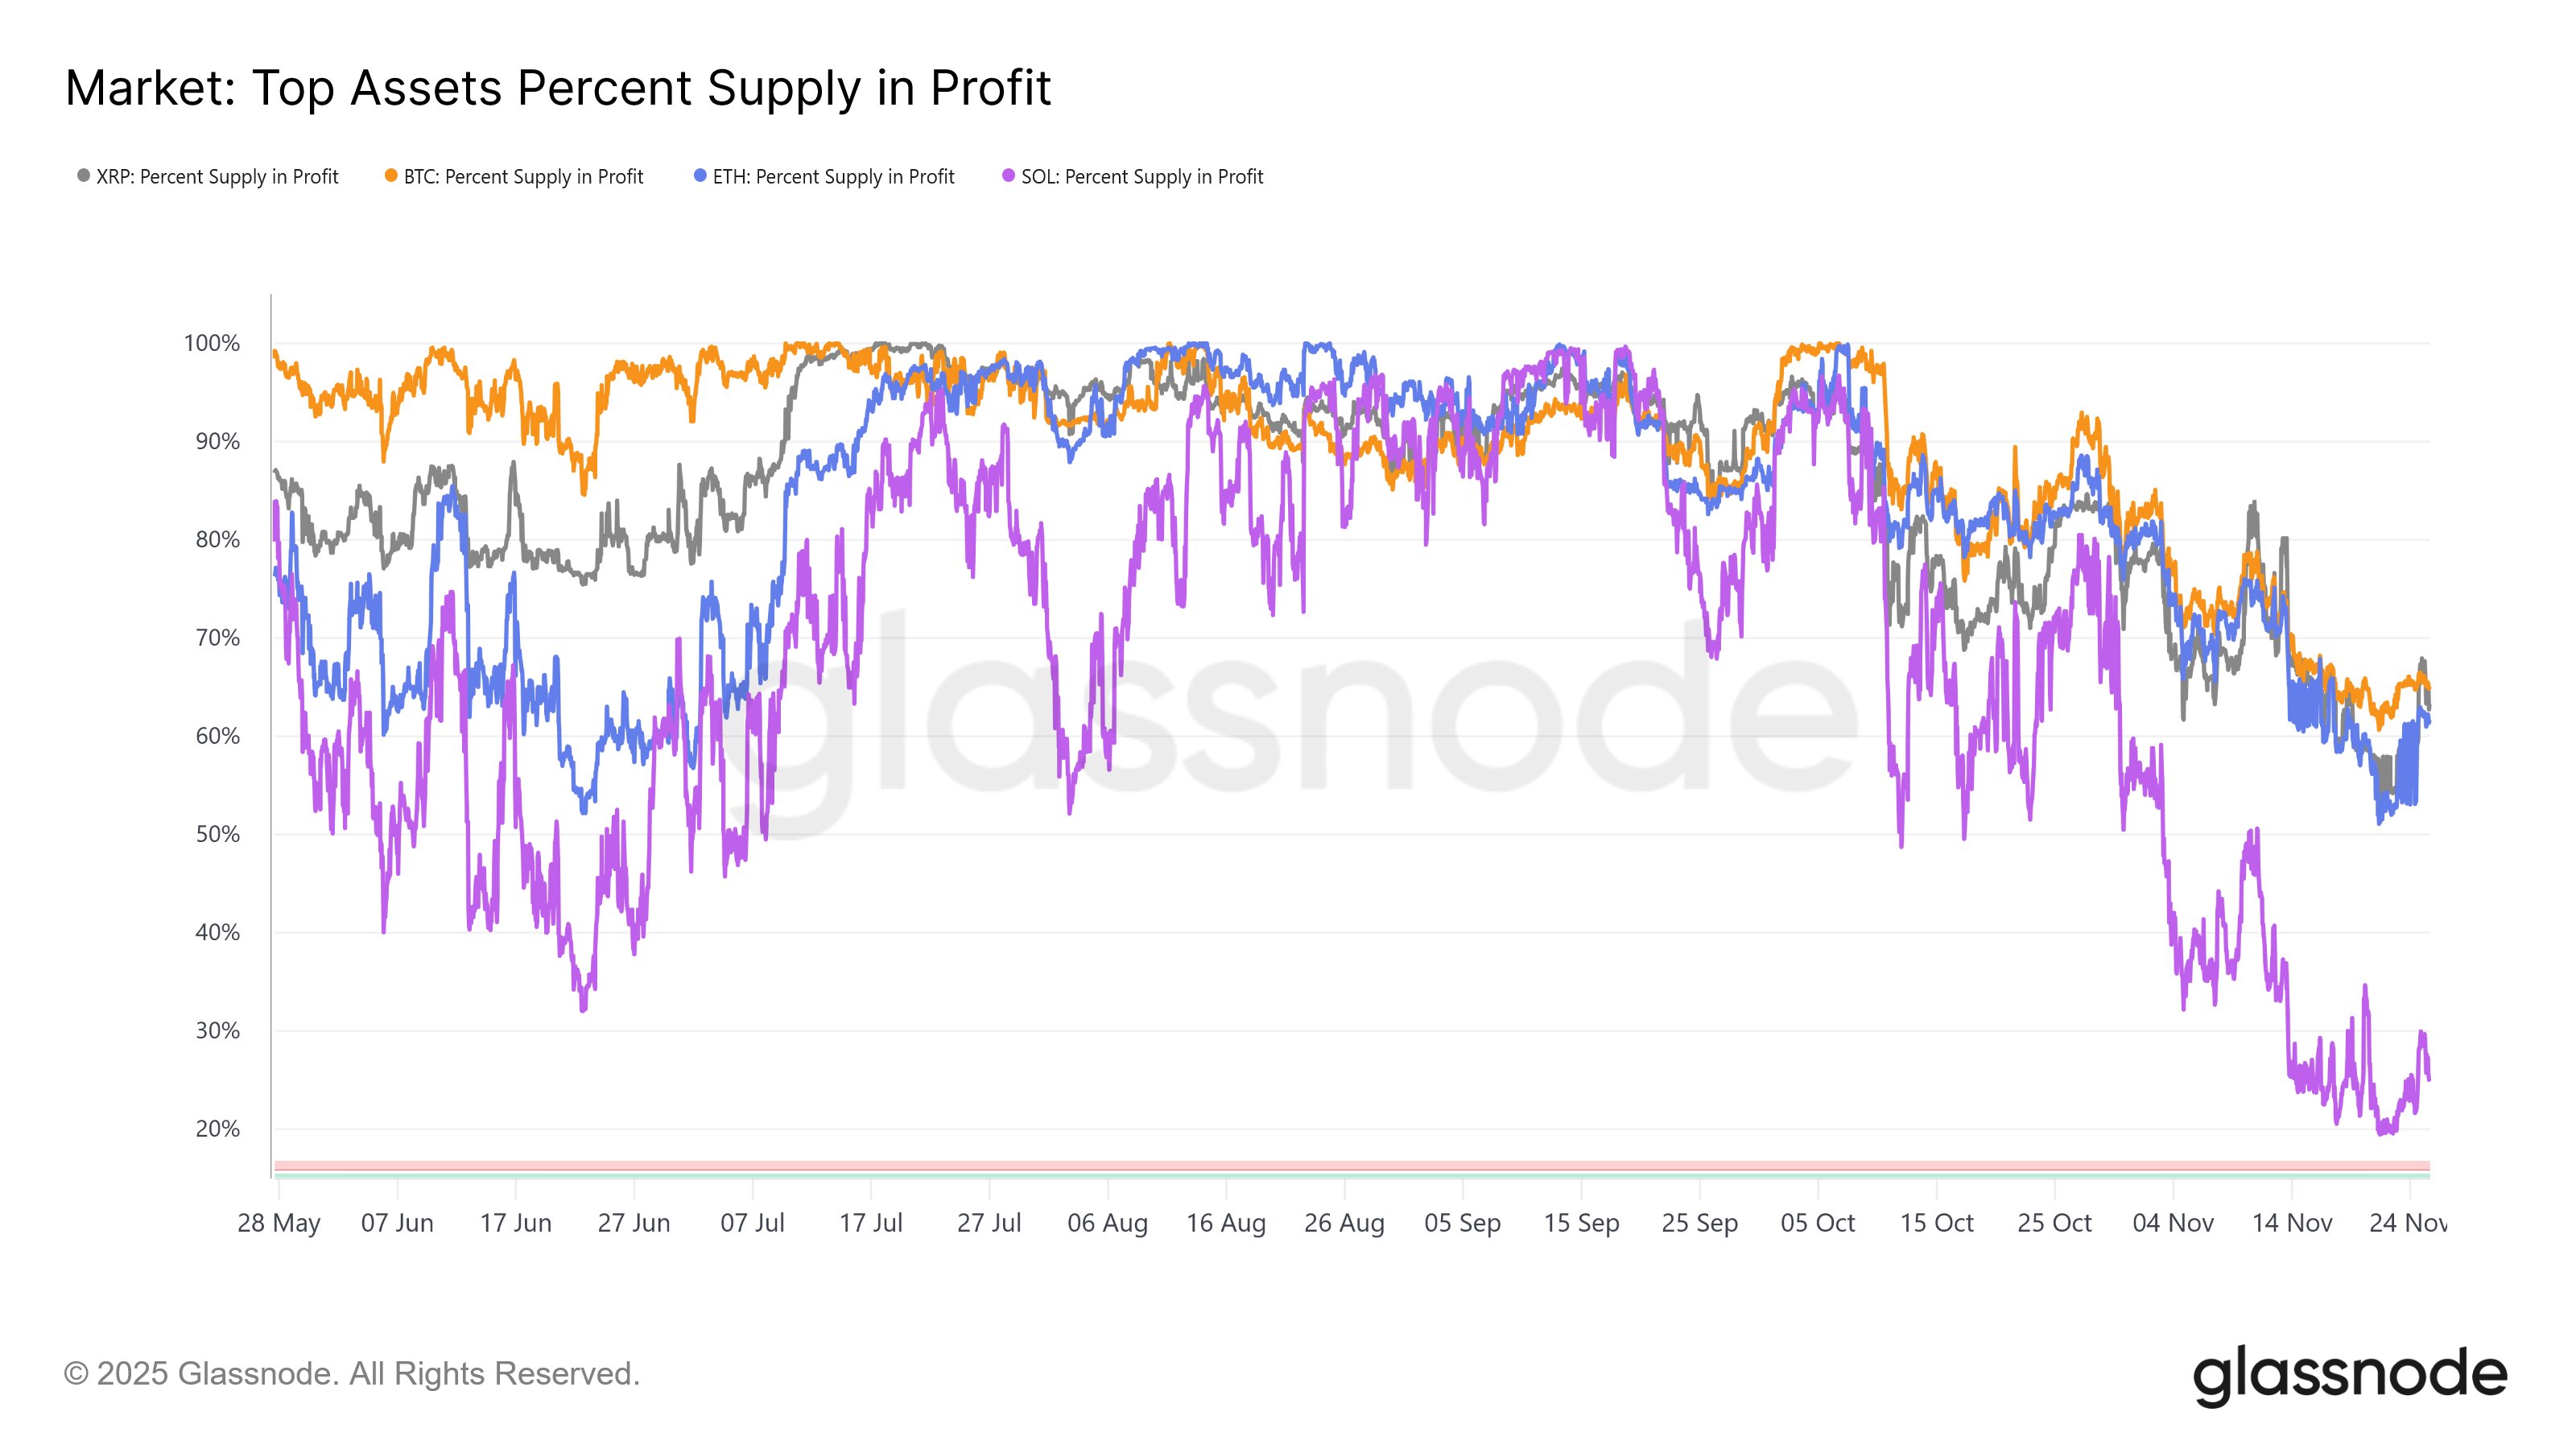
Meanwhile, an accompanying chart shows an elevated percent supply in profit for Bitcoin and XRP between May and October, before the recent price downturn pushed it lower.

However, Ethereum and Solana saw a lower percentage supply compared to BTC and XRP in May, but saw growth in between July and October. The recent correction hit SOL holders the hardest, forcing supply profitability to drop below 30% in November.

Top Asset Percent Supply in Profit/Glassnode

Remarkably, the percentage of supply in loss helps explain holder sentiment and potential market moves. Coins with more holders in loss are more likely to experience selloffs if harsh market conditions persist than those with more profitable users.