Home Blog Page 695

Here is Shiba Inu Price By 2030 If SHIB Rises Only 5% Per month 

0

Shiba Inu could eliminate a zero from its price if it registers a steady monthly growth of at least 5% from now till 2030.

The bearish performance of the broader crypto market has continued to affect Shiba Inu’s price action. This bearish action has further pushed SHIB’s price toward the $0.000012 region, with investors uncertain about the asset’s next move. 

At press time, Shiba Inu trades at $0.00001270 per token with an intra-day dip of 2.12% and a 7-day decline of 10.68%. However, SHIB’s price has slightly increased by 1.98% in the past month. Despite this slight gain, Shiba Inu remains down 39.3% YTD. 

While SHIB has underperformed most of the year, investors remain optimistic about the asset’s prospects. Interestingly, some believe that if SHIB maintains steady monthly growth, even a modest 5%, it could reach unprecedented levels. 

Shiba Inu Price If It Rises 5% Per Month Until 2030

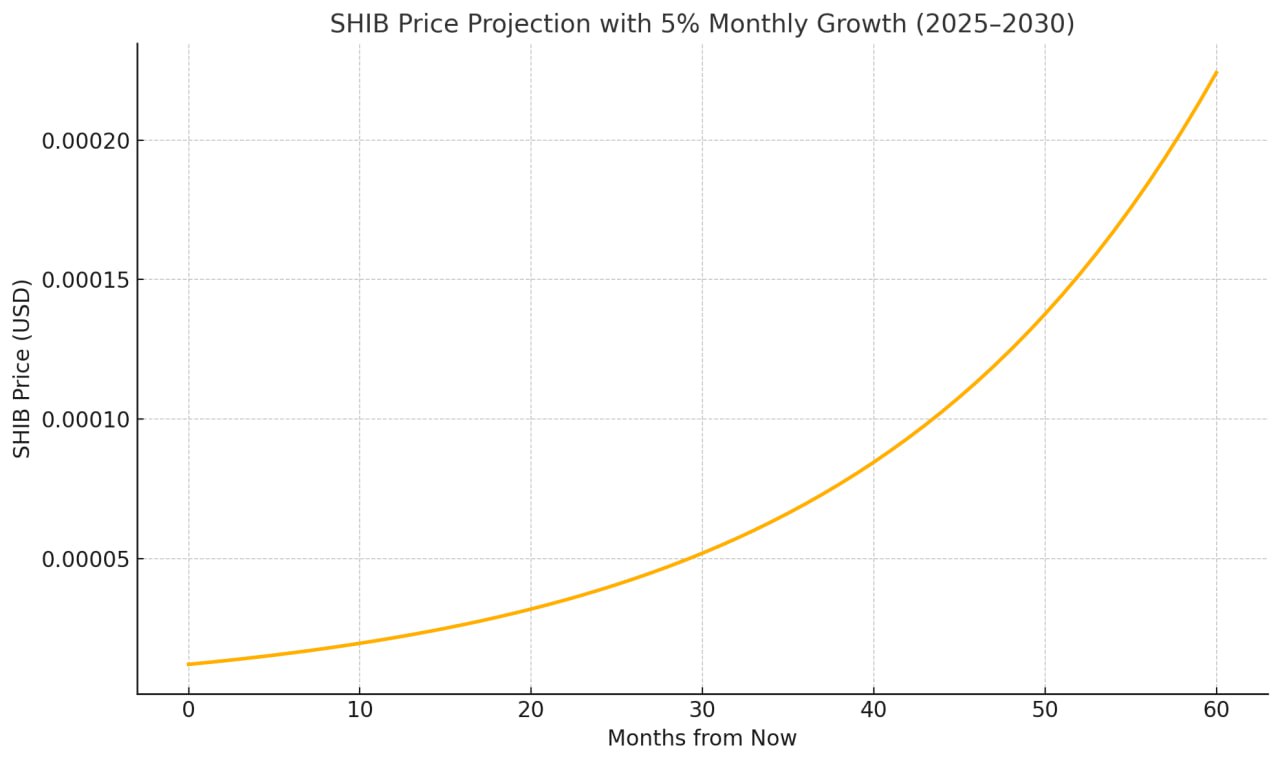
Based on this assumption, we estimated the price of Shiba Inu if it grows at a steady 5% monthly rate from now to June 2030. This analysis assumes that Shiba Inu would close each month with a minimum growth of 5% within this period. 

Although Shiba Inu currently trades at $0.00001270, we used $0.000012 as the baseline to ease the maths.

Specifically, if Shiba Inu experiences a 5% growth this month, its price would spike to $0.0000126. Another 5% growth by the end of July 2025 would push SHIB’s price to $0.00001323. 

If Shiba Inu continues to grow steadily at a 5% monthly rate, its price could surge to approximately $0.00001688 by December 2025. Assuming Shiba Inu maintains this momentum and appreciates by 5% each month, its price could reach $0.000224 by June 2030.  
Shiba Inu price if it grows 5 per month until June 2030
Shiba Inu price if it grows 5% per month until June 2030

This 5% compounding growth translates to a 1,766% increase from the baseline price of $0.000012. At the projected price of $0.000224, a portfolio of 100 million SHIB, currently worth $1,270 today, would be valued at $22,400. 

However, if Shiba Inu sees a 2% increase per month from now until June 2030, its price would only increase to $0.0000394. 

Shiba Inu’s Potential Surge to $0.0002 

Meanwhile, the $0.000224 would mark a new all-time high for Shiba Inu, potentially pushing SHIB’s market cap to $131.99 billion. Although this analysis is purely speculative, several experts had previously predicted Shiba Inu’s surge to the $0.0002 region. 

Last year, pseudonymous market commentator Analyst Michael referenced a complex Elliot Wave structure to predict Shiba Inu’s rise to the $0.0002 mark. 

In October 2024, market expert Alan Santana suggested that Shiba Inu could rise to an ambitious target of $0.0002232 this year. According to the expert, the prediction could materialize by the second half 2025. 

However, Changelly experts indicate that Shiba Inu may have to wait until June 2031 before it hits the $0.0002 mark. Moreover, the Telegaon prediction platform predicts that the $0.0002 forecast will occur by 2028, three years from now. 

Notably, this 5% compounding growth analysis assumes a scenario in which Shiba Inu experiences steady upward momentum without any dips, an unlikely pattern in the volatile crypto market.

Shiba Inu might exceed these conservative projections or face setbacks with losses in some months. Therefore, while the analysis provides insight into potential growth, investors should exercise caution.

Here’s Where XRP Price Lands If XRP Market Cap Rallies 5x and 10x

0

XRP price would be well above its 2018 all-time high if its market cap were to increase fivefold or tenfold from its current standing.

XRP, the third-largest cryptocurrency by market cap, stunned the market when it rallied a staggering 580% from its opening price of $0.50 in November to a multi-year peak price of $3.40 in January.

However, its prices have been in an accumulation mode since then, declining 35.5% from the January high. Yesterday, XRP joined another broader market retraction, dumping 2.36% in the past 24 hours to trade at $2.19.

Nonetheless, optimism around the XRP ecosystem remains largely bullish. Market watchers are optimistic that the XRPL native token will overcome recent bearish momentum and replicate its success in late 2024.

XRP’s Price On a 5x and 10x Market Cap Rally

At the current valuation of $129 billion, a fivefold rally in the XRP market cap would result in an aggregate of $645 billion. Interestingly, this is more than double Ethereum’s current $315 billion cap.

For a tenfold uptick, XRP’s market cap would hypothetically break the $1 trillion threshold to $1.29 trillion. While impressive, it still falls below Bitcoin’s $2 trillion valuation at press time.

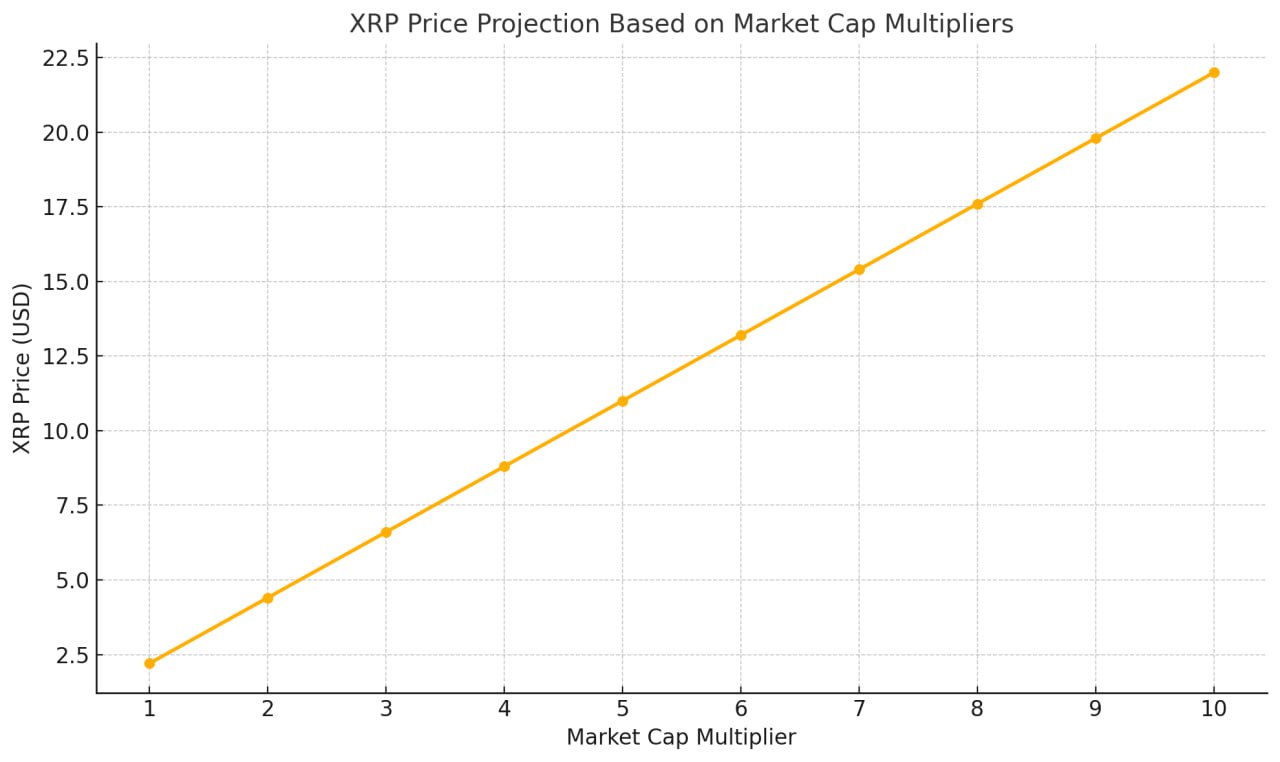
Meanwhile, an XRP market cap multiplier has projected XRP’s price on a 5x and 10x upsurge, assuming there is no change in the current circulating supply. The chart highlighted the prices from a 1x to 10x market cap multiplication.

XRP Price Prediction Based on Markrt Cap Multiplier
XRP Price Prediction Based on Market Cap Multiplier

As shown, a fivefold market cap would take XRP’s price to approximately $11, a new all-time high and an impressive 402% uptick from its current price. However, a tenfold market cap would see XRP trade at $22 per coin, representing a 904.5% increase from its current value.

Possible Timeline for XRP at $11 and $22

Notably, several analyses support a possible XRP rally to $11 and $22. For instance, seasoned market analyst Egrag Crypto predicted that the token would reach $11, citing a potential explosion from a gamma ray burst (GRB). He even projected higher prices, like $33 and $220.

Ramos also believes that a $22 XRP price and a $1 trillion market cap are feasible during this bull cycle. In his analysis, he cited bullish catalysts like Ripple’s widespread adoption, impending XRP ETF approval, and the RLUSD launch.

Meanwhile, an XRP price projection from Changelly forecasts an average price of $11 per XRP by June 2029 and $22 by April 2031. However, Telegaon predicted a closer timeframe of 2027 for $11 and 2029 for $22.

Case for an XRP 5x and 10x Market Cap Rally

The positive sentiments surrounding XRP come from several factors, including regulatory clarity, bullish ecosystem developments, and a broader market bullish reversal. For instance, the almost-concluding case between Ripple and the US SEC has seen the ecosystem ward off a major impediment to institutional traction.

Interestingly, this has been the case as prominent market players are beginning to adopt XRP. Investment vehicles tracking XRP’s performance have recently launched as institutional and retail demand for the asset increases, while some, like spot ETFs, are still awaiting regulatory approval.

Furthermore, corporate firms have also started adopting an XRP treasury strategy. Messari, a top market research and intelligence platform, highlighted this bullish development in a recent report. Three prominent firms have announced plans to establish an XRP corporate treasury within a month, indicating a growing recognition of the asset’s value.

As a result, market watchers expect these bullish developments to impact XRP’s valuation, making a case for a five to tenfold rally in XRP’s market cap.

Will PEPE Hold $0.00001108 as Bears Take Control?

PEPE risks a pullback to $0.000010 as bearish momentum intensifies, despite large-holder inflows. Will the support level at $0.00001108 hold?

As meme coins mirror Bitcoin’s pullback, Pepe faces a steep correction amid growing bearish momentum. The emergence of an evening star pattern signals a potential decline toward the psychological support level at $0.000010.

PEPE Price Analysis

On the daily chart, PEPE’s price action shows a bullish failure to surpass the 50% Fibonacci retracement level at $0.00001212. With a 3.59% drop on Wednesday, PEPE formed an evening star pattern near a critical support-turned-resistance level.

PEPE Price Chart
PEPE Price Chart

This marks a post-breakout retest turnaround for PEPE, raising the risk of a drop below the 50-day EMA at $0.00001146. If the bearish trend persists, the 200-day EMA at $0.00001108 remains the next crucial support level.

However, if bearish pressure continues, PEPE could retest the next key supply zone near $0.0000090.

Essentially, this short-term reversal underscores the growing risk of the meme coin losing the $0.000010 psychological support.

Supporting this downside risk, the daily RSI remains below the midpoint, signaling a gradual increase in bearish momentum.

On the flip side, a breakout above the 50% Fibonacci level could pave the way for a rally toward last month’s peak at $0.0000155.

Pepe Derivatives Reveal Bears in Action

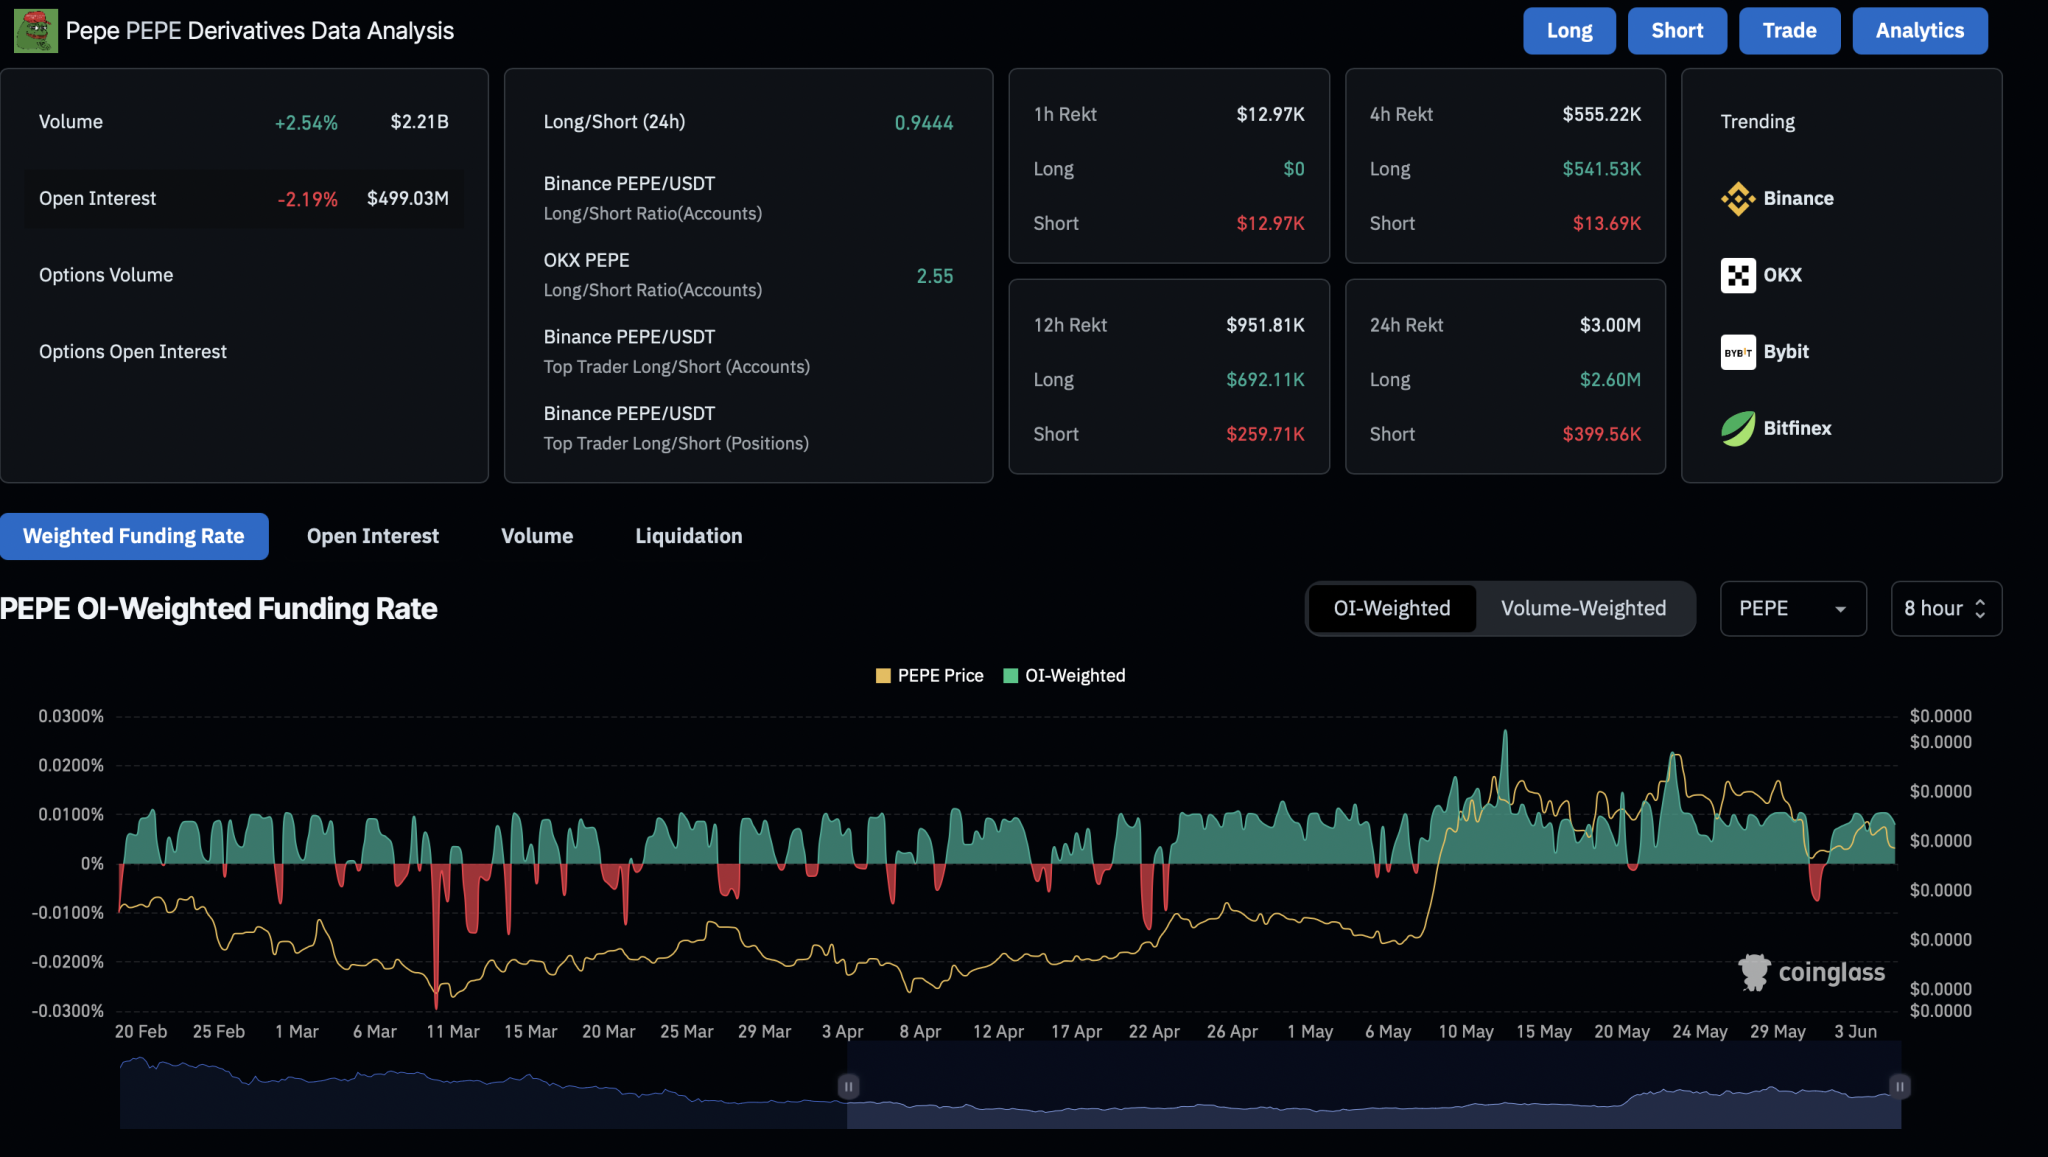
Amid the rising pullback risk, derivatives interest in Pepe has turned negative. Open interest is down 2.19% to $499 million. Meanwhile, long liquidations have surged to $2.6 million in the past 24 hours, indicating a major wipeout of bullish positions compared to just $399K in short liquidations.

Additionally, the funding rate has declined to 0.0079%, reflecting weakening bullish sentiment in trading activity. Data from CoinGlass points to a potential pullback in Pepe amid increasing market volatility.

PEPE
PEPE

Large Holder Netflow Surge Signals Growing Confidence

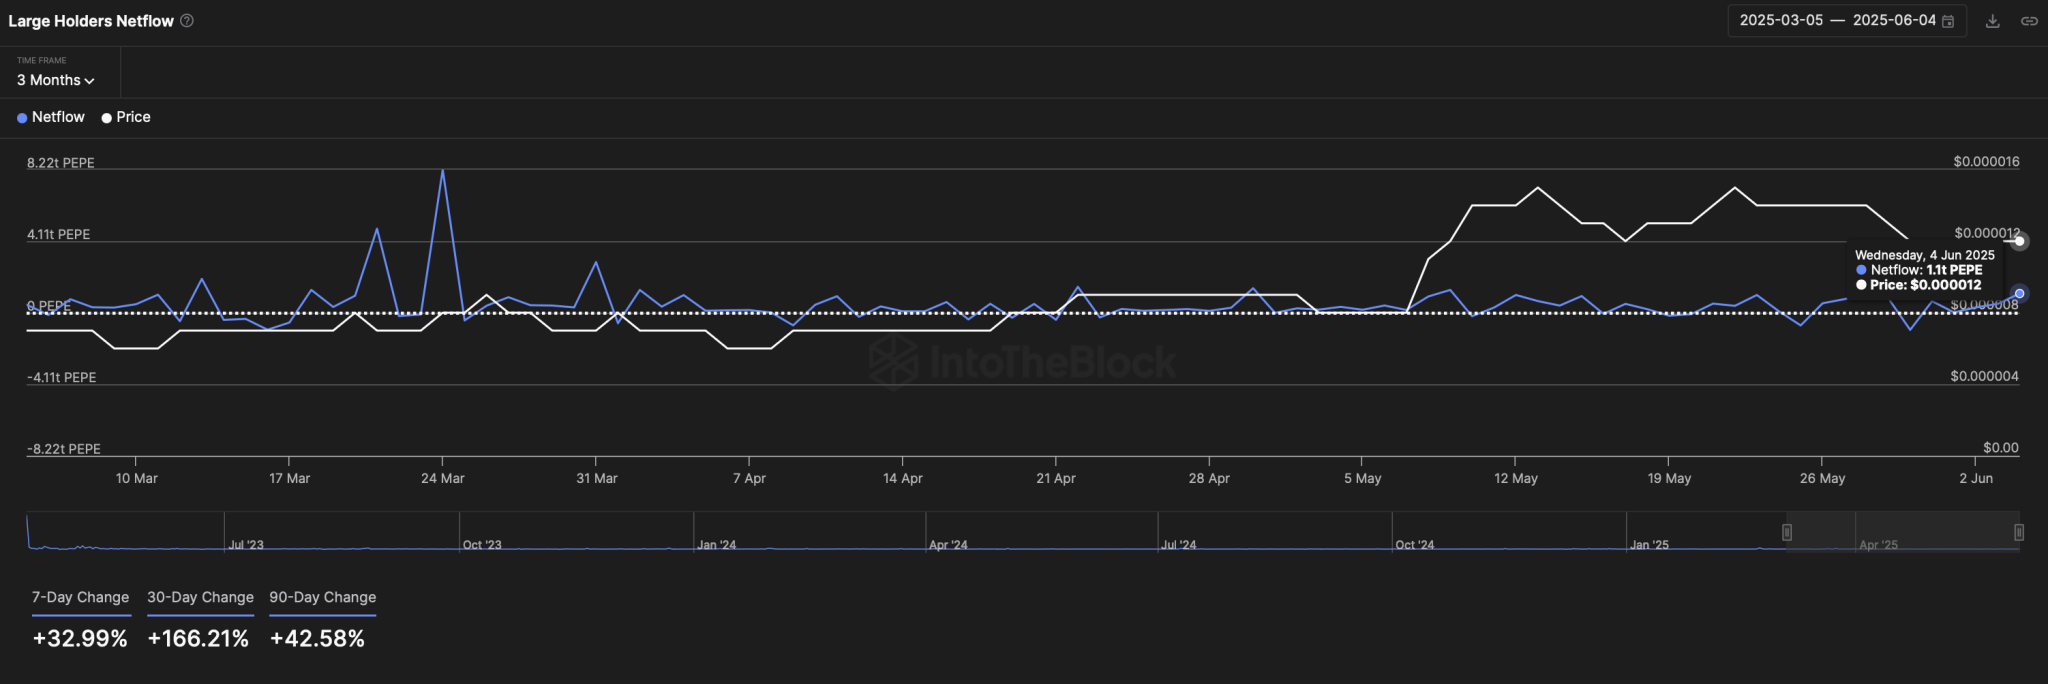
According to IntoTheBlock data, net inflows from large holders have risen nearly 33% over the past seven days. On June 4, net inflows reached 1.1 trillion PEPE, indicating significant accumulation and rising investor confidence.

Positive net flow trends over the past 30 and 60 days further support the possibility of a bullish reversal in Pepe. 

PEPE
PEPE

Here’s Why Bitcoin Network Growth Is Spiking Amid Price Stagnation

0

Bitcoin on-chain activity is rising despite limited price movement, signaling growing network participation.

Notably, Bitcoin’s price has seen limited movement in recent days, hovering between $103,000 and $106,000. As of today, the price stands at $104,802, reflecting a 0.69% decline in the past 24 hours and a 3.35% drop over the past week. 

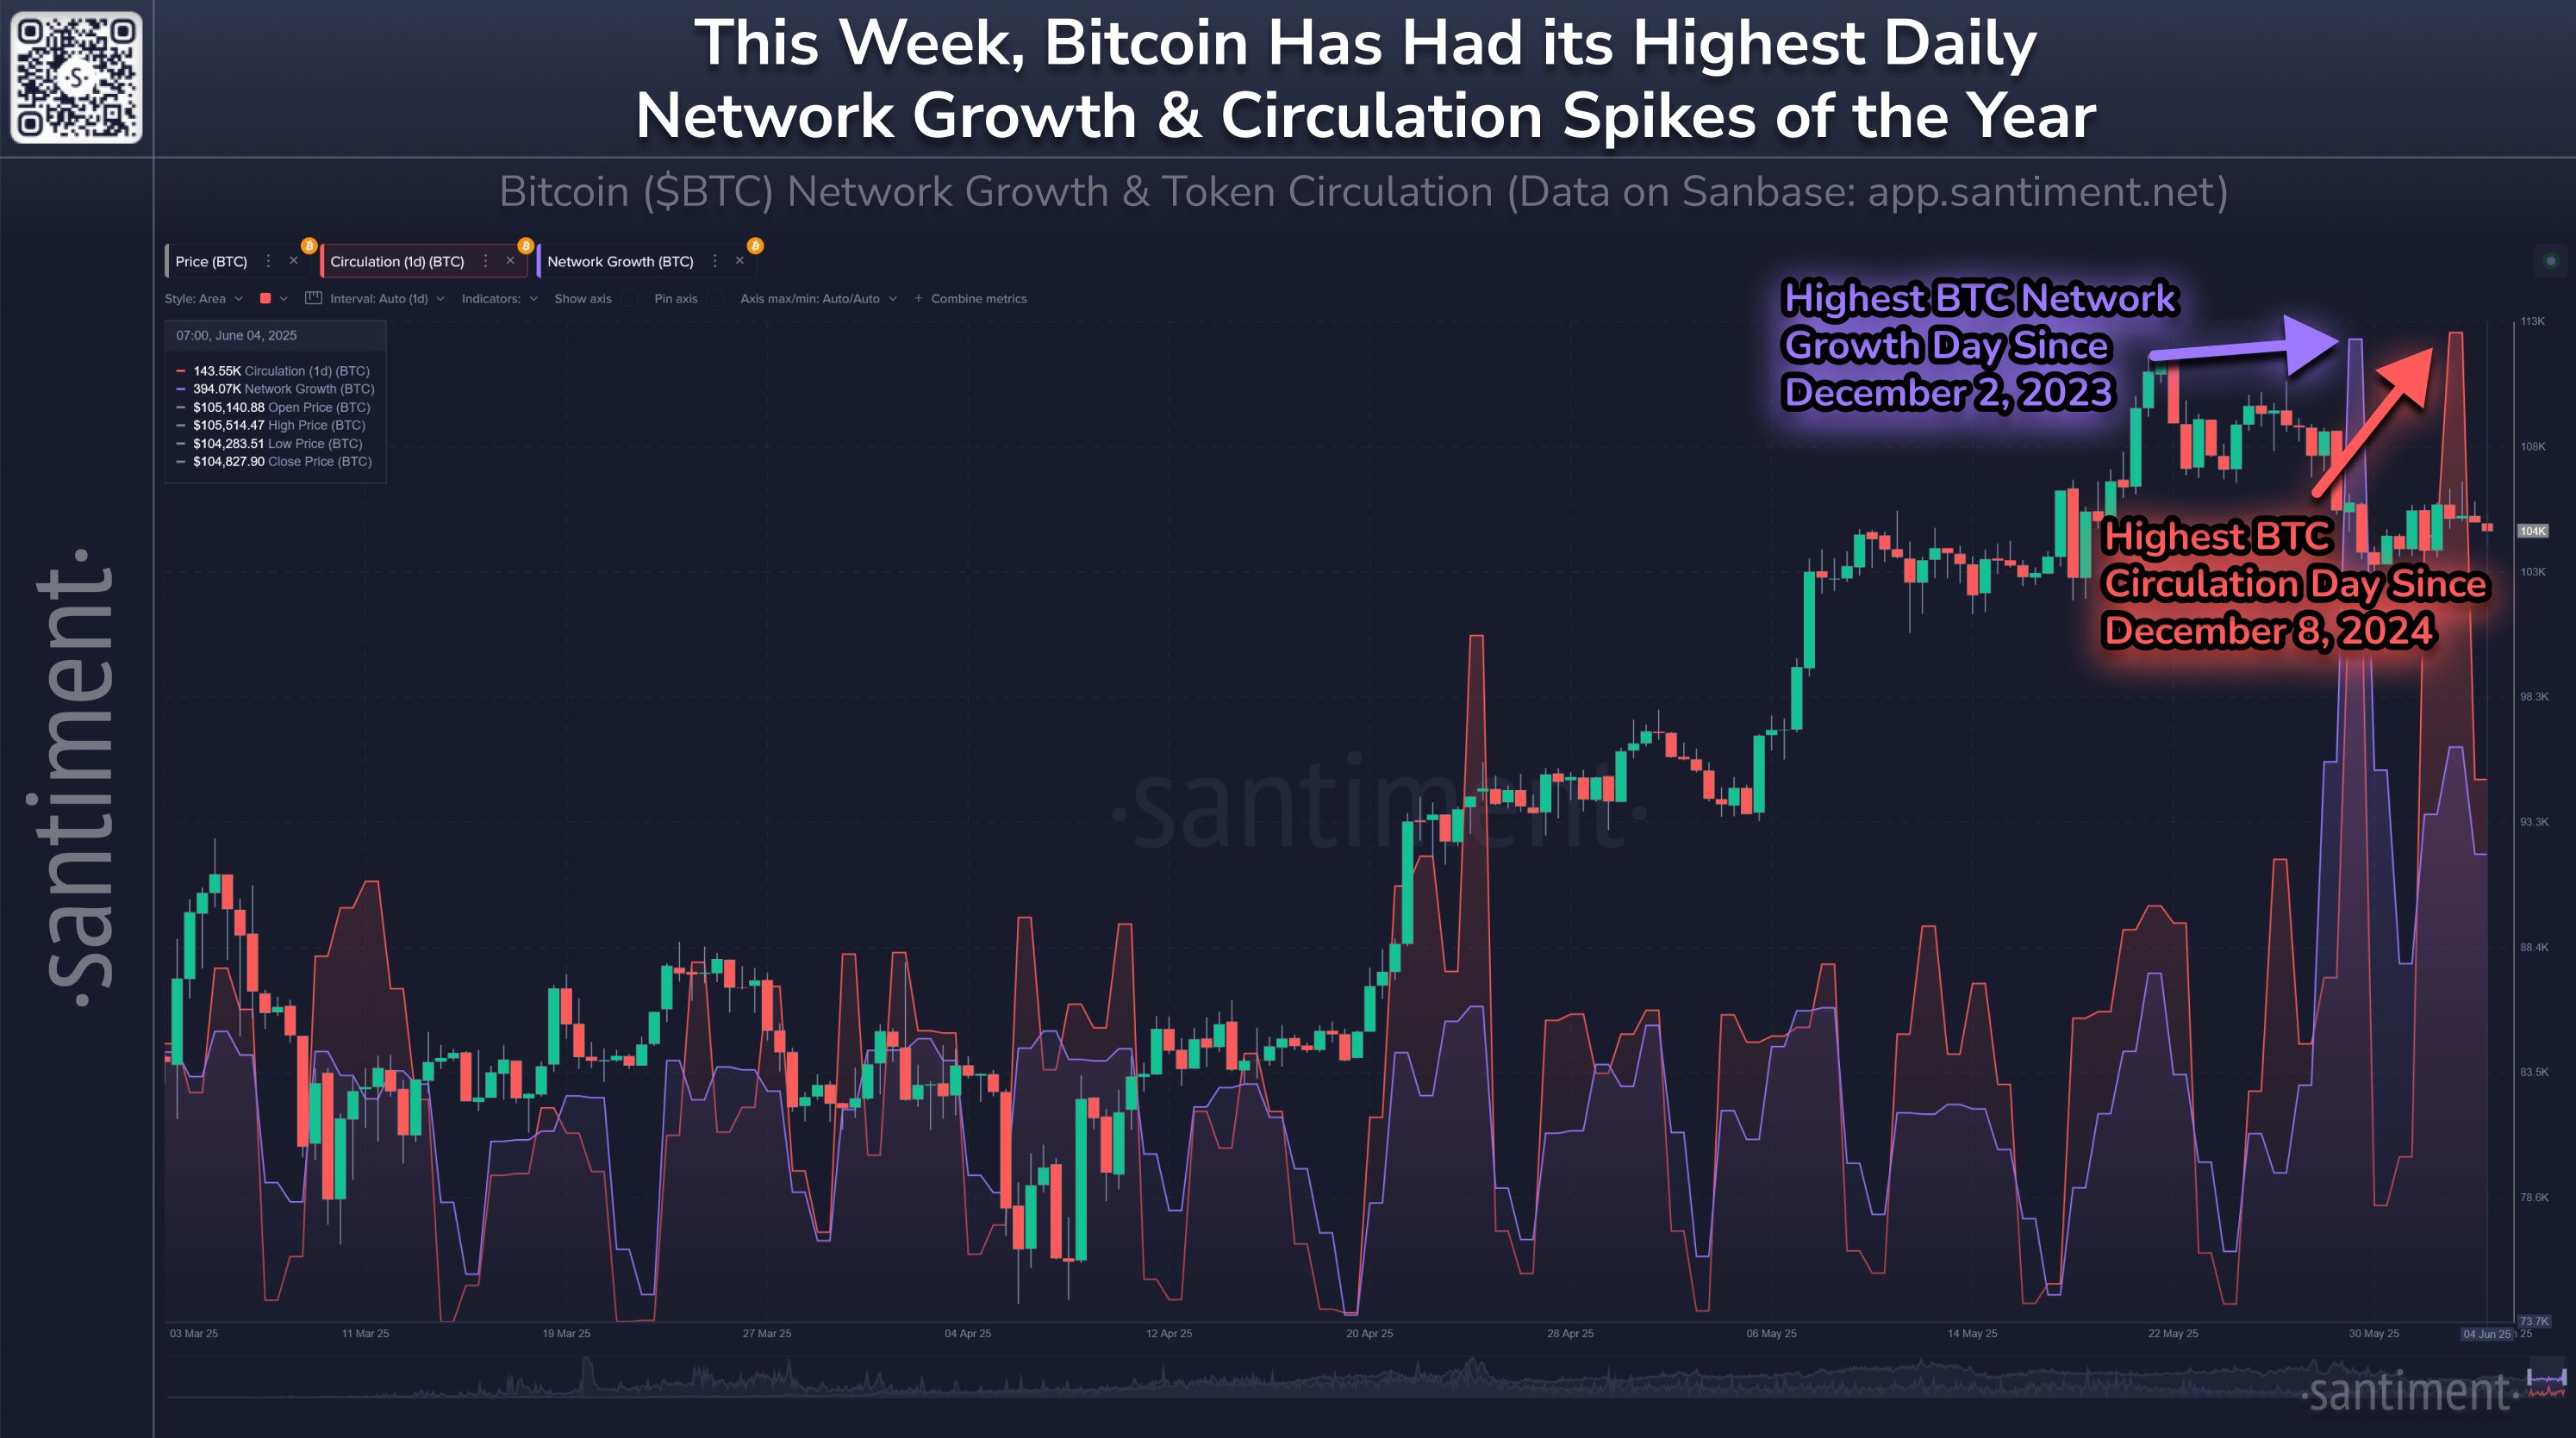
Despite this stagnation, Bitcoin’s on-chain activity has experienced notable growth. Analysts at Santiment, a market intelligence platform, have pointed out a surge in Bitcoin’s on-chain activity, which typically reflects increased user engagement and expanding network participation.

Image

Surge in Bitcoin Network Growth

Specifically, on May 29, 2025, Bitcoin witnessed a significant spike in network growth. A total of 556,830 new wallets were created on that day, marking the highest increase in new wallet creation since December 2023. This sharp rise in network growth signals increased interest and participation in the Bitcoin ecosystem. 

Notably, this increase in network growth occurred even as Bitcoin’s price remained relatively stable just below $105,000. This suggests that factors other than price action, such as increased awareness and adoption, are driving new users to the Bitcoin network. As more individuals create wallets, the potential for further network expansion and long-term growth remains high.

High Token Circulation Points to Active Market

Meanwhile, on June 2, 2025, Bitcoin saw a significant spike in token circulation, with 241,360 BTC transacted on that day. This surge marked the highest daily token movement since December 2024.

The rise in token circulation signals a more active market, with Bitcoin being moved at higher volumes between wallets. Increased circulation often correlates with heightened trading activity, suggesting that more investors and traders are engaging in Bitcoin transactions.

Analysts from Santiment highlighted that growth in a network’s on-chain activity is generally a positive sign for the market. According to Santiment, this growth should be closely monitored.

Accumulation by Large Bitcoin Holders

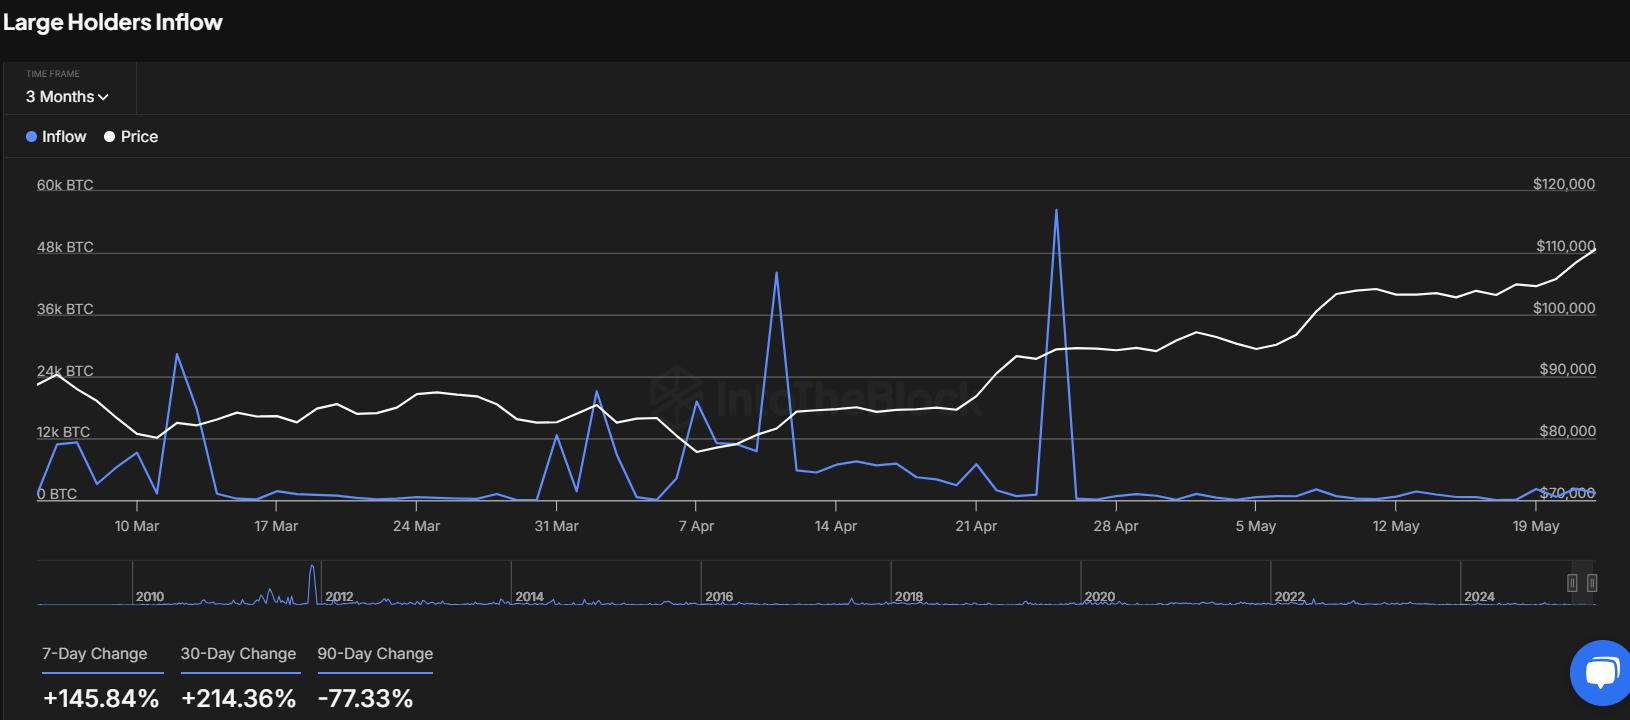
Amid this increased network activity, data from IntoTheBlock shows that large Bitcoin holders, or “whales,” have been steadily accumulating more Bitcoin in recent weeks. 

A chart from IntoTheBlock reveals a sharp increase in Bitcoin inflows to large holders, with a 145.84% rise over the past 7 days and a 214.36% increase over the past 30 days. 

Screenshot 2025 06 05T123855422
Bitcoin Large Holders Inflow

These inflows indicate that substantial investors are buying Bitcoin in large quantities, which could contribute to an upward pressure on the price.

Moreover, a recent report by The Crypto Basic showed that wallets holding between 10 and 10,000 BTC have also been accumulating Bitcoin at a rapid pace. In just one week, these wallets added 79,244 BTC, averaging 11,321 BTC per day.

As of June 2, the total holdings of these wallets surpassed 13.57 million BTC. The increased accumulation by large holders could lead to a tightening of Bitcoin’s supply on exchanges, further contributing to potential price movements.

Dogecoin Risks Crashing to $0.14 as Meme Market Weakens

Dogecoin approaches the $0.18 support level as the meme coin market drops below $60 billion. With Long liquidations rising sharply, is a retest of $0.14 next?

As Bitcoin slips below $105,000, meme coins are trending downward. The segment’s total market cap has fallen below $60 billion, with the leading meme coin, Dogecoin, down nearly 4% in the past 24 hours. Under these conditions, is Dogecoin likely to retest the crucial $0.14 support level?

Dogecoin Analysis

On the daily chart, Dogecoin’s price action reveals a bullish failure to break through the $0.25 supply zone. This has led to a pullback below the 200-day EMA and the 23.60% Fibonacci retracement level near $0.21.

Dogecoin Price Chart

Currently, Dogecoin is finding critical support near the $0.18 supply zone. However, the meme coin dropped 2.6% on Wednesday, hinting at the potential for a deeper correction.

Based on price action, a drop below the $0.18 support zone would invalidate the possibility of Dogecoin forming a cup-and-handle pattern with a neckline at $0.25. In such a scenario, the decline will likely extend to the $0.14 support level.

Supporting the bearish thesis, the daily RSI has fallen from the overbought zone to below the midpoint, signaling a shift in momentum to the downside. Any potential reversal in Dogecoin may face resistance near the $0.21 supply zone

Long Liquidations in DOGE Cross $5 Million

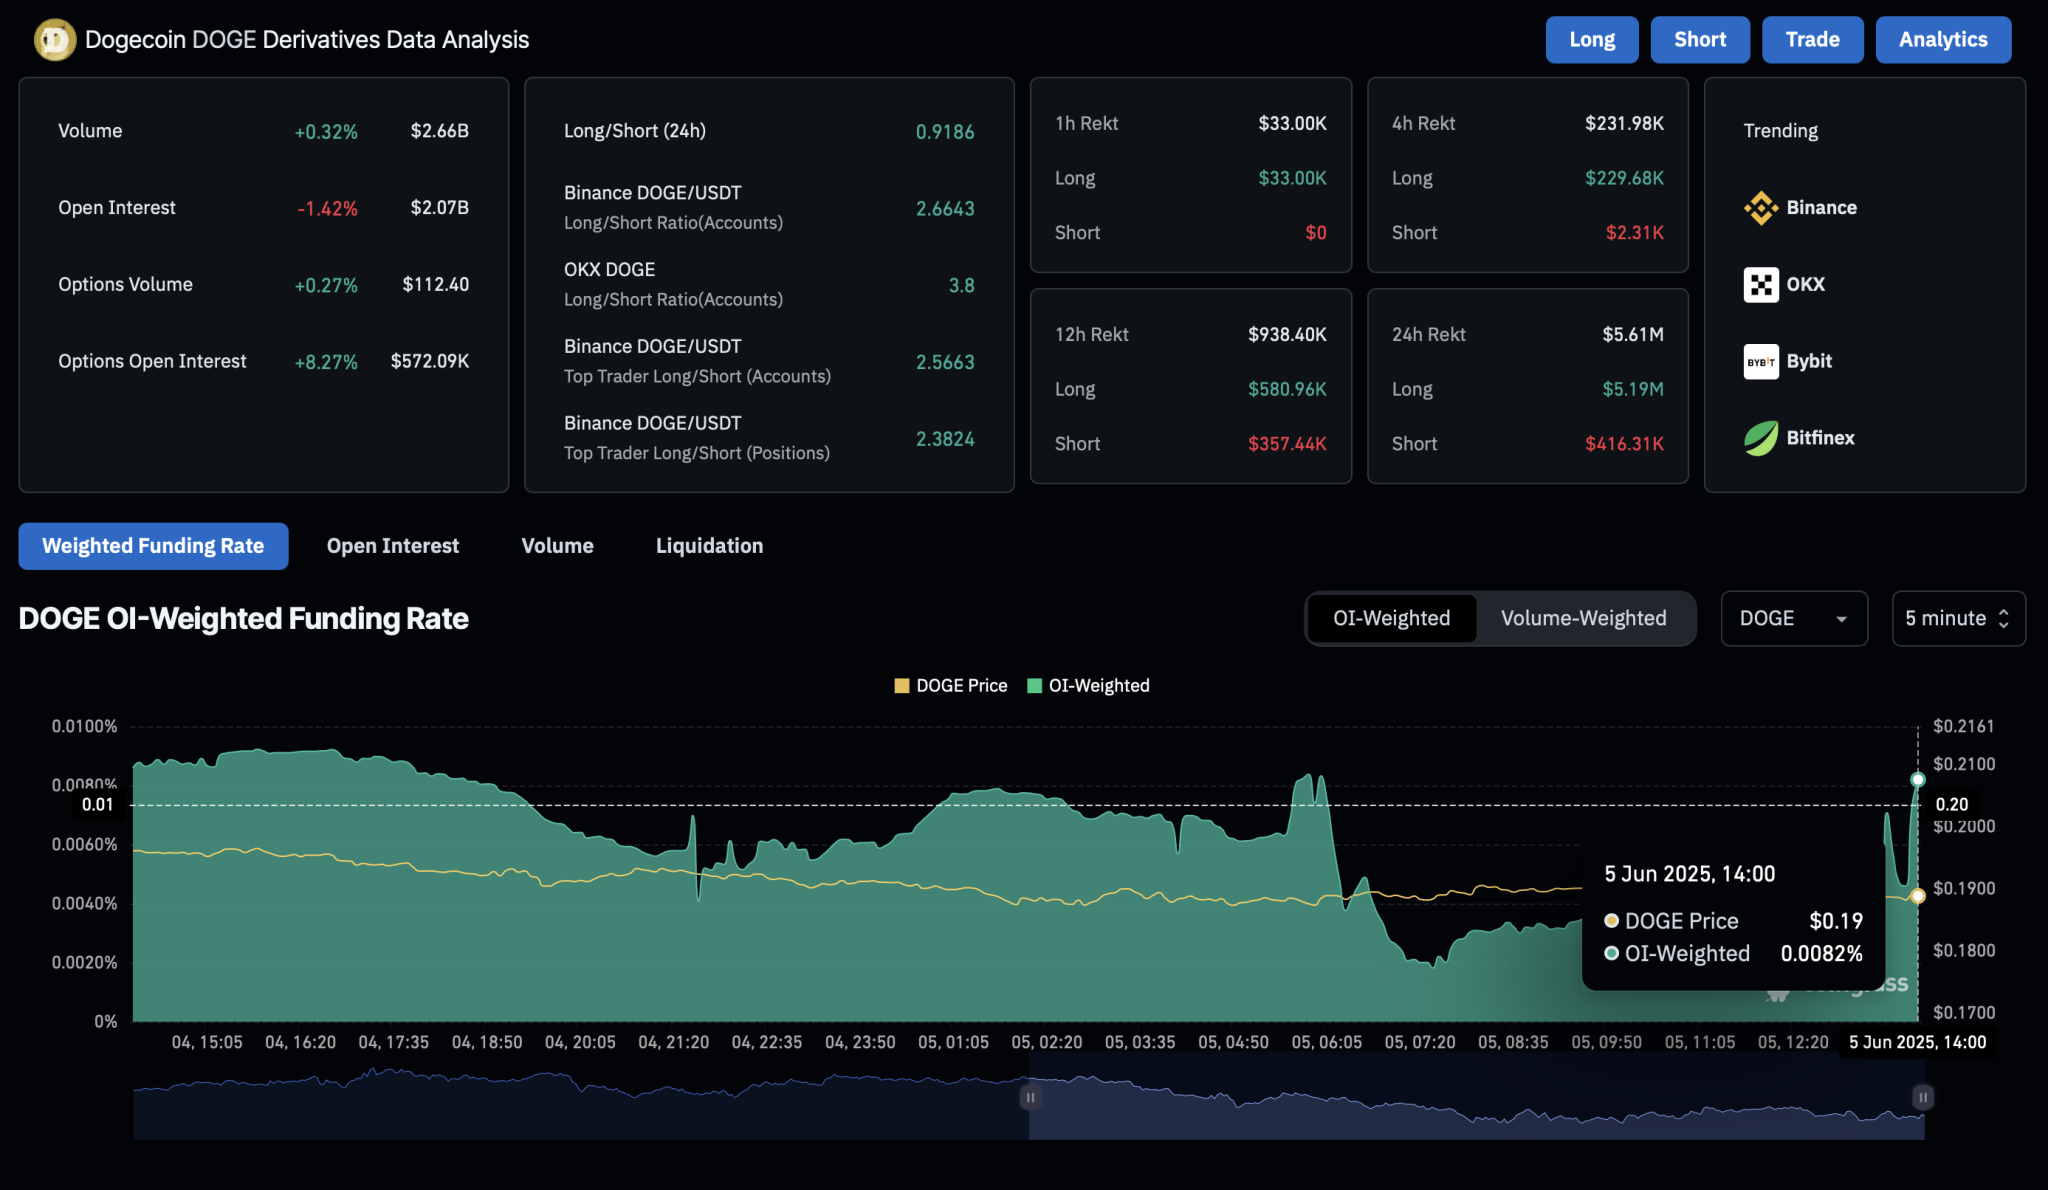
With the recent pullback, the Dogecoin derivatives market reflects a massive wipeout of bullish positions. Over the past 24 hours, the long liquidations account for $5.19 million. Meanwhile, short liquidations were only $416k. This reflects more than ten times the number of bullish positions wiped out in comparison to the counterpart. 

DOGE Derivatives
DOGE Derivatives

Additionally, open interest in DOGE is down by 1.42% to $2.07 billion, suggesting waning trader participation. However, in the short term, sentiments recover as the OI-weighted funding rate surges to 0.0080% after dipping to 0.0020% within the past 24 hours.

Bitcoin Falls Below $105K Again: Is $100K the Next Stop?

Bitcoin has fallen below $105K as bearish divergence and weak derivatives data signal a deeper correction ahead.

As Bitcoin dips below the $105,000 mark, declining bullish momentum warns of a steeper correction beneath a crucial support trendline. Could this potential breakdown push Bitcoin back to the $100,000 level?

Bitcoin Price Analysis

Bitcoin’s four-hour chart showcases a bullish failure to cross above the $112,000 level, creating an all-time high at $111,970. With multiple lower highs, Bitcoin is back at a crucial support trendline as it breaks under the 50 and 100-period EMAs. 

Bitcoin price chart
Bitcoin price chart

According to Fibonacci levels, the decline breached the 23.60% retracement level at $107,545. Additionally, the sudden pullback is signaling a potential bearish crossover between the 50- and 100-period EMAs.

Currently, Bitcoin trades at $104,639, reflecting a drop of more than 6% from the all-time high. As the price falls, the daily RSI line has turned bearish, moving below the midpoint. This reflects waning bullish momentum and raises the likelihood of a breakdown.

Based on Fibonacci levels, a potential close below the support trendline at $103,534 would increase the chances of a deeper correction. However, several support levels lie nearby, including the 200-period EMA at $103,230 and the 50% Fibonacci level at $102,795, which could potentially absorb selling pressure.

That said, a breakdown below the 50% Fibonacci level could open the door for Bitcoin to retrace toward the $100,000 mark, with the final line of defense at the May low of $101,763.

Conversely, a bounce from the support trendline could lead to a retest of the 23.60% Fibonacci level at $107,545.

Derivatives Data Suggests Drop in Optimism

With the pullback in the Bitcoin spot price, CoinGlass data shows a 0.84% drop in open interest, now at $70.59 billion. Over the past 24 hours, declining interest among derivative traders has resulted in the liquidation of $35.88 million in long positions, while short liquidations remain limited at $7.20 million.

ETH Derivatives
ETH Derivatives

Additionally, the funding rate has declined to 0.0020% from a recent high of 0.0047%, signaling a significant reduction in bullish trading activity. As a result, the derivatives market is showing a notable increase in bearish sentiment.

“This Is Just the Beginning,” Cathie Wood Shares Why Bitcoin Will Go Higher from Here

0

Ark Investment’s CEO, Cathie Wood, has explained why Bitcoin price would continue to appreciate to unprecedented heights.

In an interview, Wood identified that Bitcoin remains in an early growth phase. Despite its six-figure valuation, she emphasized that the premier crypto asset would continue to appreciate, citing its nascent institutional presence and favorable demand-supply dynamics.

Still the Beginning for Bitcoin

There are only 5.4% of Bitcoin’s 21 million total supply yet in circulation, which amounts to approximately 1.13 million BTC. Furthermore, the remaining Bitcoins have been spread across the next 115 years, a reality check for those yet to take the orange pill.

Wood emphasized that Bitcoin is getting scarce. An interesting detail to this is that institutions have yet to arrive on the scene at scale. While the statistics are improving daily, with new firms adding Bitcoin to their reserves, a vast majority of prominent firms have yet to adopt the prominent cryptocurrency.

Notably, Bitwise CIO Matt Hougan recently noted that while 95% of Bitcoin is already in circulation, 95% of investable capital remains unexposed. Meanwhile, a study from Tephra Digital also showed that Bitcoin still cannot access $31 trillion in wealth, as financial advisors continue to observe the asset’s progress.

As a result, Wood noted that it is just the beginning for Bitcoin. According to her, institutions that would adopt Bitcoin from here would have to buy up the newly mined BTC, which dropped again to 3,150 BTC per week with the 2024 halving.

Another option is to “pay up” to get retail holders to sell off their stash. Recall that a Bitwise report showed that over 69% of Bitcoin’s supply is in the hands of individuals. As a result, institutions would have to hope that they paper-hand their Bitcoin to have some to buy.

Conclusively, Wood highlighted that Bitcoin’s scarcity value will increase due to the huge supply-demand imbalance, driving prices higher. Additionally, this simple economics would continue to ensure that the asset’s price appreciates indefinitely.

Wood’s Price Target for Bitcoin

Meanwhile, Wood and Ark Invest had already given their Bitcoin prediction for the next five years. An earlier projection had shown a rally to $1 million by 2030. However, the bullish developments surrounding the asset have prompted a review.

Ark Invest updated its predictions to $300,000 for a worst-case scenario and $2.4 billion in a best-case scenario. The reviewed outlook based the possible 2,197% rally on growing institutional and nation-state traction towards Bitcoin.

Wood also mentioned that Bitcoin would hit $1.5 million in a mildly bullish setting by 2030. At the time of writing, BTC trades at $104,499.

JPMorgan to Accept Bitcoin ETFs as Loan Collateral: Report

0

JPMorgan Chase is reportedly planning to unveil a new offering that will allow its wealth-management clients to use crypto ETFs as loan collateral.

Bloomberg recently reported the development, citing people with direct knowledge of the matter. According to the report, JPMorgan, the largest U.S. bank by assets, would allow its trading and wealth-management clients to use certain crypto assets, specifically crypto ETFs, to secure loans. 

Starting with BlackRock’s iShares Bitcoin Trust (IBIT), JPMorgan would allow users to pledge the shares of this Bitcoin ETF as collateral to borrow money. 

It is worth noting that IBIT is the world’s largest Bitcoin ETF. As of June 4, IBIT had approximately $70 billion in net assets, 236% more than Fidelity’s FBTC, the second-largest ETF.  

Although the offering would initially begin with the IBIT ETF, JPMorgan plans to expand the supported assets to other Bitcoin ETFs. Notably, Bloomberg’s sources claimed that the new service will officially commence in the coming weeks. 

According to one source, JPMorgan previously allowed clients to pledge their crypto ETFs as collateral only on a case-by-case basis. Now, the bank intends to extend this capability to its wealth-management customers. 

JPMorgan to Consider Clients’ Crypto Holdings in Assessing Net Worth 

Furthermore, the leading U.S. bank will include customers’ crypto holdings in their net worth assessments. This would enable the bank to determine the maximum loan amount that eligible clients can obtain. 

Based on this condition, clients with significant cryptocurrency holdings can unlock larger credit lines compared to those with smaller cryptocurrency portfolios. In the meantime, JPMorgan has not released an official statement confirming the initiative. 

JPMorgan’s Crypto Support 

Although JPMorgan’s CEO, Jamie Dimon, has been a major critic of crypto, the bank has unveiled several crypto-related initiatives. According to Dimon, while he does not think people should invest in Bitcoin, he still defends their right to do so. 

So far, it has leveraged blockchain for payments and also serves multiple crypto businesses, including Coinbase. 

Following Donald Trump’s inauguration, which paved the way for a favorable regulatory environment in the U.S., major banks have introduced several crypto initiatives. For instance, JPMorgan’s major rival, Morgan Stanley, announced plans to launch spot crypto trading for retail clients. 

The Crypto Basic reported that Morgan Stanley retail customers would be allowed to trade selected cryptos like Bitcoin via the bank’s E*Trade platform using their existing brokerage accounts. 

Here is How Much Top 10% on XRP Rich List Will Make, If XRP Price Hits $10

Investors who have managed to enter the top 10% on the XRP rich list could see some impressive gains when XRP finally reaches a two-digit price.

Notably, the crypto market recently entered another consolidation phase, and XRP followed suit, dropping to retest the $2.2 price level again. This comes after the altcoin failed to capitalize on the earlier Bitcoin (BTC) upsurge that pushed its price to new all-time highs last month.

As a result of Bitcoin’s solo rally, which left altcoins like XRP behind, Bitcoin dominance has continued to surge. However, analysts believe an imminent drop in Bitcoin dominance is on the horizon. This would massively benefit XRP and other altcoins.

Analysts Target XRP to $10

With the market expecting the altcoin season to take shape soon, several market watchers have projected price targets for assets such as XRP. For instance, analyst DK64Trades suggested last month that he is sure XRP will eventually break above $10. He cited the XRP dominance in his argument. 

Also, the founder of CryptosRUs, George Tung, indicated in a May interview that he sees XRP reaching $10 by the end of the year. For context, a $10 price would represent a 354% increase from the current price, and while most proponents believe this target is conservative, the consensus is that XRP could claim it soon.

At this price, investors could witness impressive gains depending on the amount of XRP they hold. Community commentators like Edoardo Farina have consistently charged investors to accumulate at least 10,000 XRP tokens. 

How Much Top 10% on XRP Rich List Will Make if XRP Hits $10

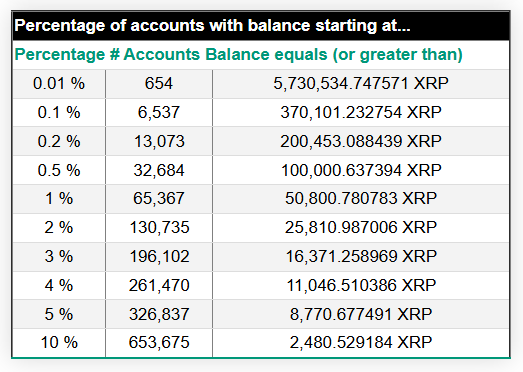
In previous instances, Farina also suggested that investors amass enough XRP tokens to at least enter the top 10% on the XRP rich list. He made this suggestion in February when the requirement to enter the top 10% XRP rich list was 2,501 XRP. Today, this threshold has dropped to 2,480 XRP.

XRP Rich List
XRP Rich List

If an investor can amass these 2,480 XRP tokens to secure a spot among the top 10% on the XRP rich list, they could see some subtle gains when XRP claims $10. Notably, these tokens are currently worth $5,456 at XRP’s current price of $2.2. If prices surge to $10, these 2,480 XRP tokens will be worth $24,800, a yield of $19,344.

However, it bears mentioning that not all investors within the top 10% on XRP rich list hold exactly 2,480 XRP, as this is merely the least amount to hold to enter this elite group. Others hold more up to 8,770 XRP. Those on the topic 10% list with 8,770 tokens currently sit on $19,294. If XRP hits $10, this investment will hit $87,700, a profit of over $68,000.

Analyst Says the Longer XRP Consolidates, the Stronger the Breakout

As XRP trades sideways for over six months, a prominent market analyst suggests this elongated consolidation could lead to a sharper price uptick.

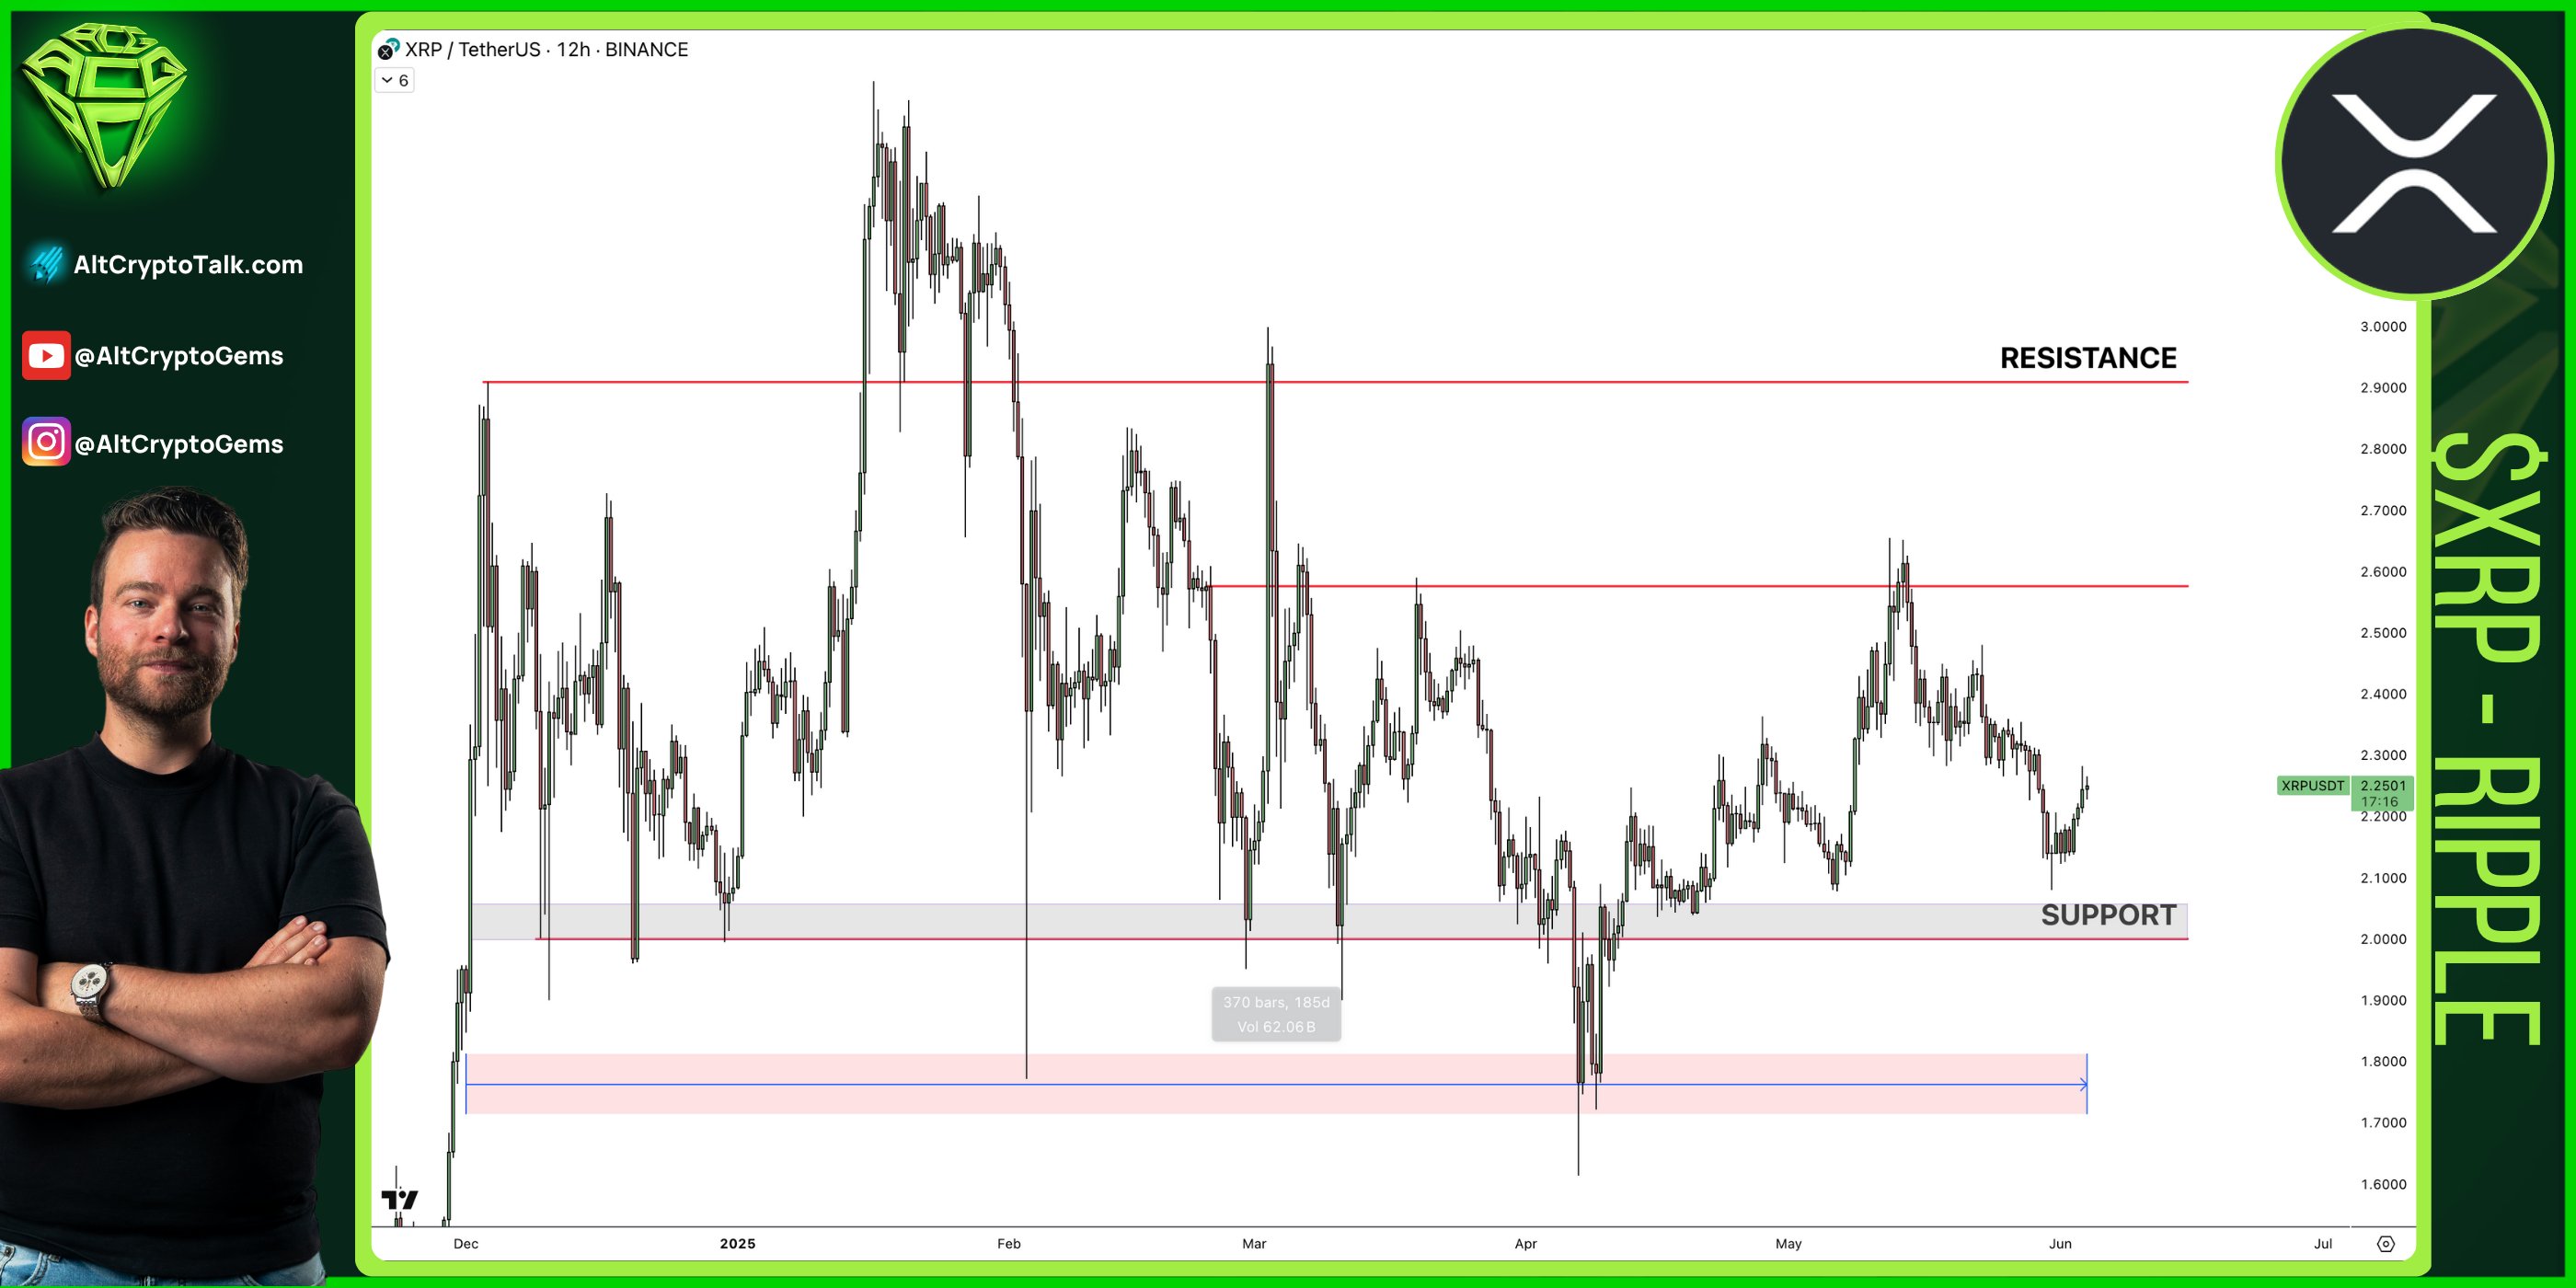
According to crypto analyst Sjuu, the digital asset has spent approximately 190 days consolidating within the $2 and $2.6 mark, frustrating both bulls and bears. This movement followed the cooldown from the rally that pushed XRP to $3.40 in January.

While enthusiasts eagerly await a continuation of the bullish trend, the coin has taken longer than expected to climb, despite Ripple’s favorable partnerships, regulatory news, and improved market sentiment during this period.

Support Holding, but Resistance Still Dominates

On the 12-hour XRP/USDT chart shared by Sjuu, XRP recently bounced from the support area around $2.10, showing signs of resilience.

However, upper resistance zones near $2.60 and $2.90 continue to cap any breakout attempts, keeping the asset in a prolonged state of indecision.

Image
Sjuu XRP chart shared on X

Notably, this observation follows XRP’s dip to $2.08 on May 31. It has since recovered slightly to around $2.28, but at press time, it’s trading lower at $2.18.

With this continued range-bound pattern, Sjuu pondered whether XRP will ever break out and how long it could take. This back-and-forth price action has left holders frustrated.

“The Longer the Consolidation, the Stronger the Breakout”

Despite the sluggish price action, Sjuu remains optimistic. The analyst reminded XRP investors that extended consolidation periods often precede significant price movements.

This perspetive recalls how XRP staged a dramatic 6X rally between November 2024 and January 2025 after consolidating for seven years. As XRP now enters another passive phase, market participants are watching closely for a decisive move.

Key Levels to Watch for an XRP Comeback

In a separate commentary, analyst EGRAG highlighted $2.30 as a key short-term resistance level.

A three-day candle close above this mark and the 21-day EMA could confirm a double bottom and trigger a rally toward $2.50, $2.65, and even $3.00.

XRP would need just a 7% gain to break this level, though bearish sentiment remains a challenge. Support at $2.07 is considered crucial for maintaining the bullish setup.

Meanwhile, EGRAG’s analysis suggests that XRP has the potential for a 1,200% surge to $25 once bullish momentum takes hold.

This projection is largely based on the Elliott Wave structure, which suggests XRP has completed its corrective Phase 2 and may be entering a bullish Wave 3.

This correction followed XRP’s peak of $3.40 in January, with a dip to $1.60 before rebounding above $2.00. Though recent price action remains sluggish, momentum could soon build.

Moreover, analyst XForceGlobal presented an even more bullish outlook, targeting $40 for XRP, while calling $10 a conservative estimate based on the same Elliott Wave structure.