Home Blog Page 730

SHIB Price May Jump to $0.000033 in Upcoming Rally, Analyst Says

0

An analyst says Shiba Inu may continue ranging below trendline resistance before a breakout triggers a heavy pump.

Shiba Inu (SHIB) experienced modest upward movement over the past 24 hours, registering a 2.83% increase. Despite this recent uptick, the price has remained below the $0.000014 mark, fluctuating within a narrow range. 

The intraday chart reflected a gradual rise followed by a brief correction on May 19. However, this short-term bullish behavior has not altered the broader technical outlook, as the asset continues to trade under a dominant descending trendline. 

This resistance, in place since SHIB’s retreat from the $0.00004 peak earlier in 2024, has remained unbroken, keeping the long-term bearish structure intact.

Descending Trendline Continues to Dictate Shiba Inu Structure

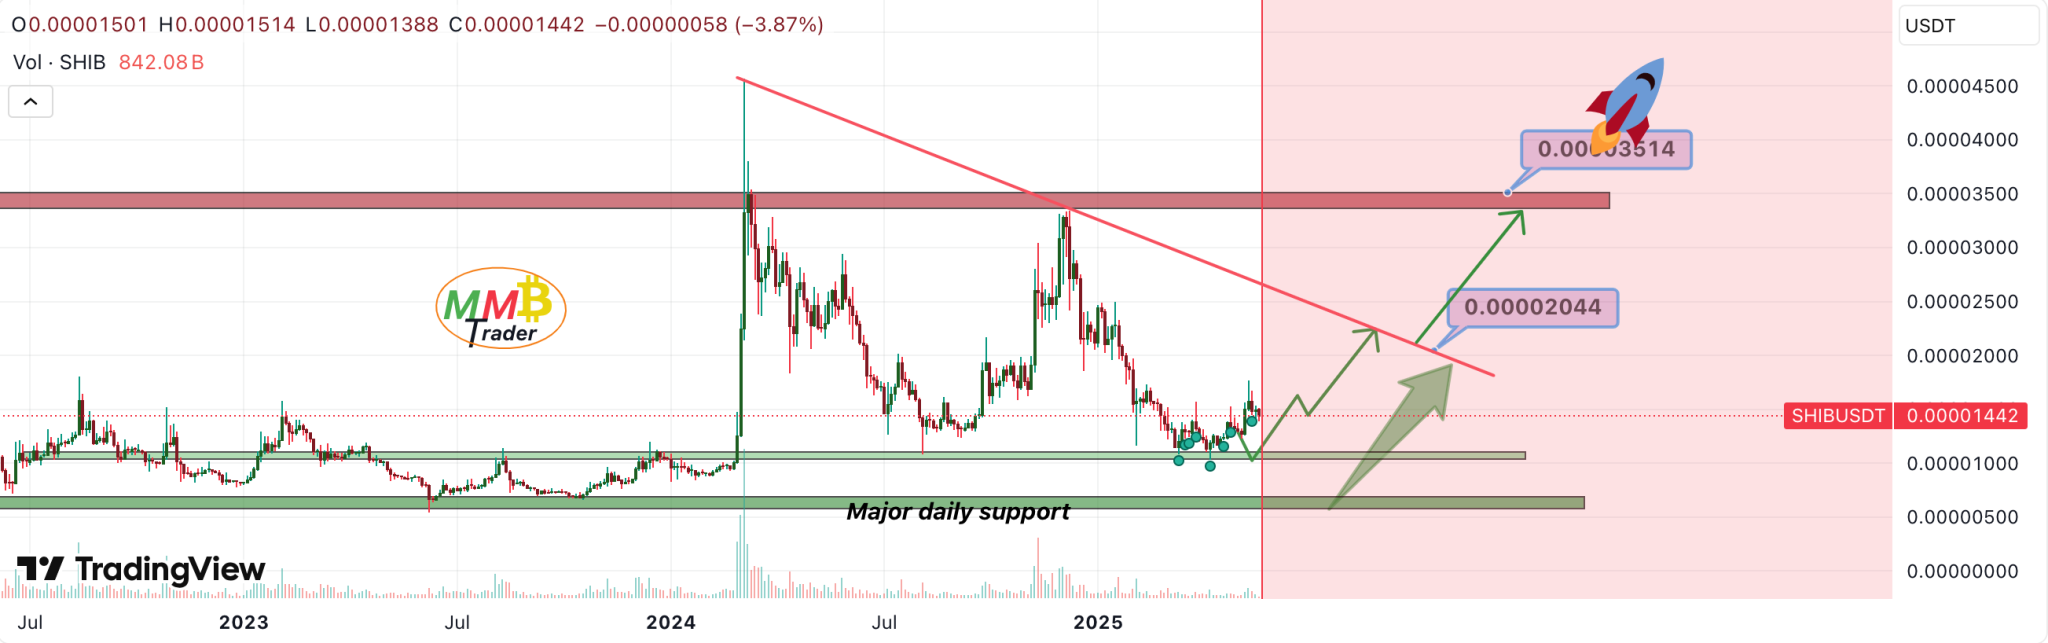
Analyst MMBTtrader’s chart on TradingView reiterates the persistent impact of the descending trendline, which has acted as dynamic resistance throughout 2024. SHIB has made multiple attempts to rally, most recently targeting the $0.000033 level in December 2024, but failed to hold above key resistances.
Shiba Inu Price Prediction

Per the chart, each rejection reinforced the broader bearish structure, leading the token to retreat to a local support zone of around $0.00001110.

According to MMBTtrader, the trendline currently caps resistance at approximately $0.00002044. He suggests that until SHIB breaks above this level, bullish momentum is unlikely to be sustained. Despite the resistance, the analyst anticipates extended ranging behavior beneath the trendline. 

He notes that this consolidation phase may precede a breakout, at which point the market could experience a heavy pump. If SHIB manages to overcome this dynamic resistance, the projection places the next major price target at $0.000033.

Consolidation Persists Despite Temporary Price Recovery

Further technical insight comes from analyst Şeyma, who analyzed SHIB’s performance across multiple timeframes. On the weekly chart of the 1000SHIB perpetual contract, she identifies a prolonged downtrend beginning in December 2024.

Currently, the token is in a consolidation phase, where the price compresses within a defined range. This stage often precedes directional breakouts, requiring confirmation through specific resistance levels.

Şeyma notes that a weekly close above $0.000015 would be the first signal of possible bullish continuation. However, she emphasizes that confirmation requires a clean breakout above the next key resistance at $0.000017.

Only a breakout above both thresholds would validate a shift in market structure. In such a scenario, the path could open toward a higher target of $0.000030.

Derivatives Data Reflects Balanced Sentiment 

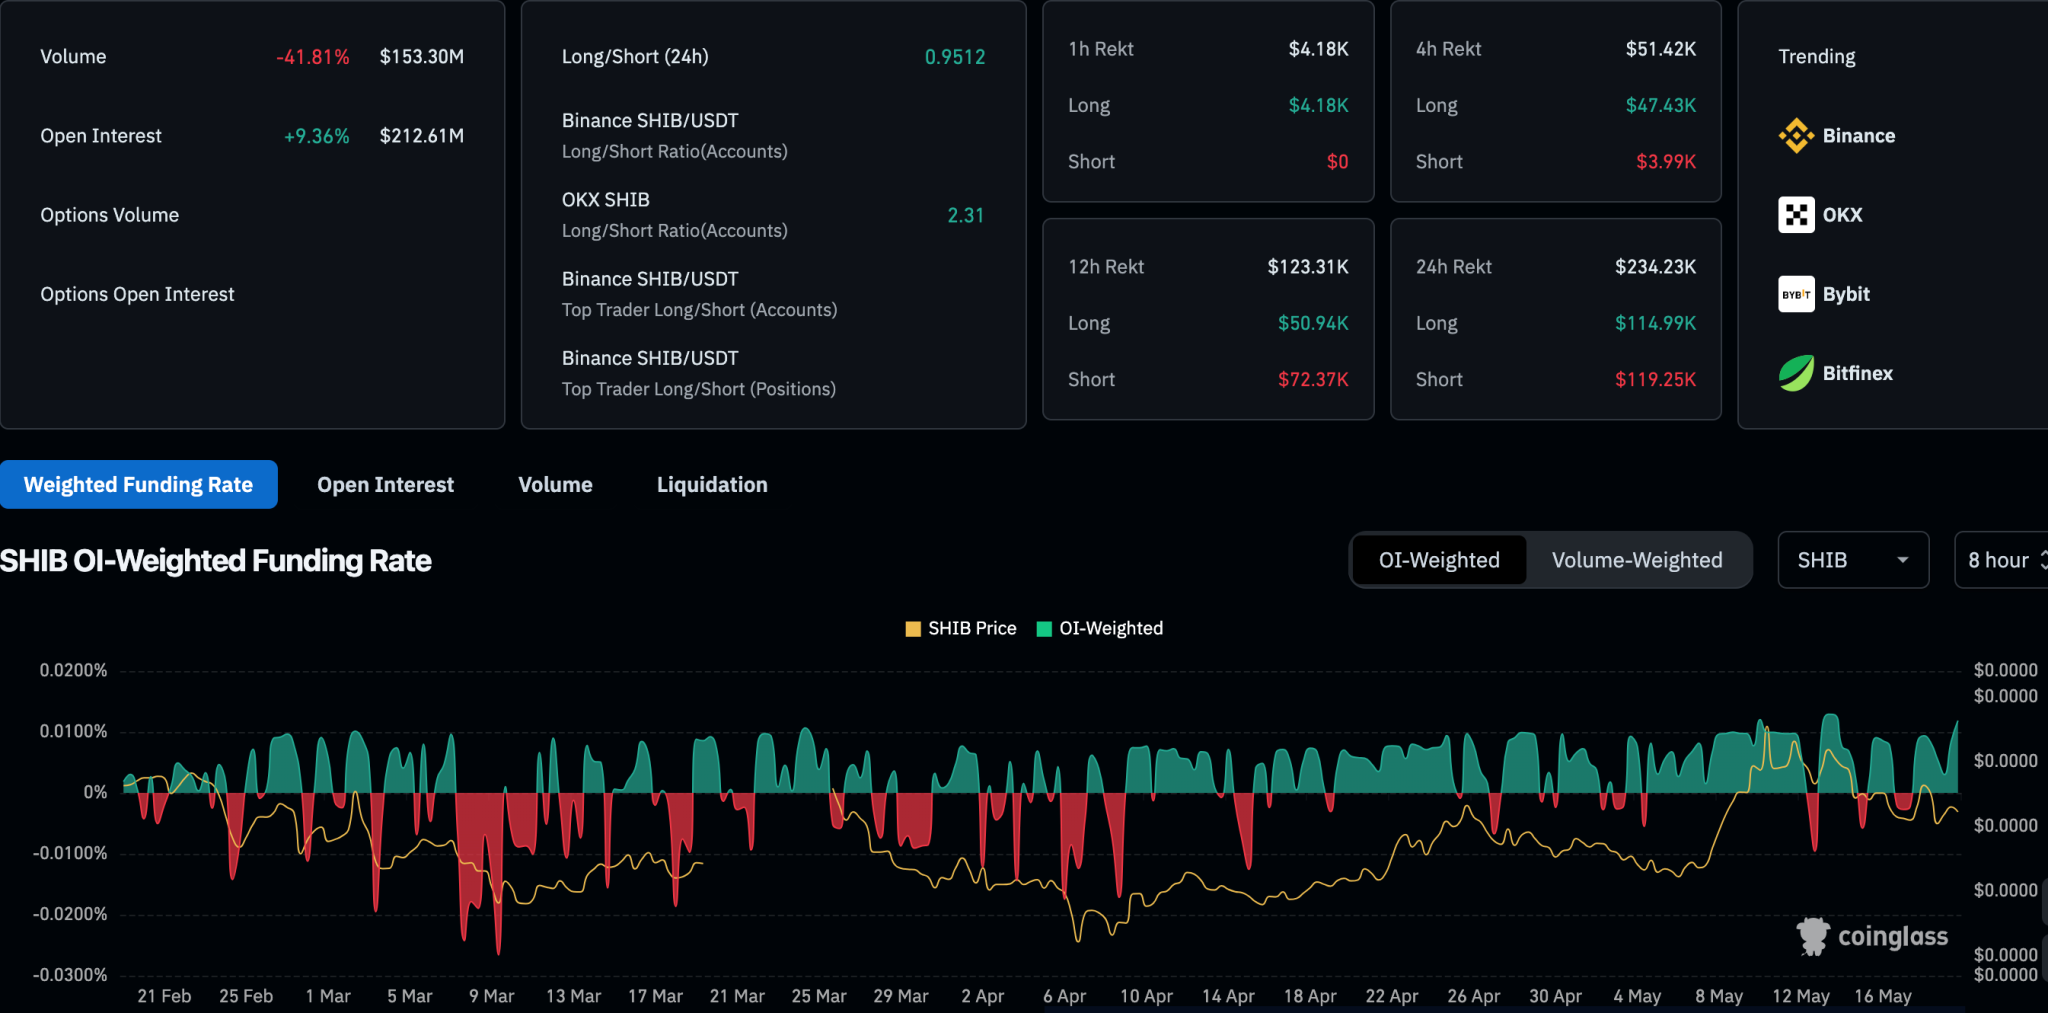
Beyond spot price action, the SHIB derivatives market presents key signals of ongoing trader activity. According to Coinglass, open interest in Shiba Inu derivatives rose by 9.36% in the past 24 hours, reaching a total of $212.61 million. This suggests participants are holding onto existing positions longer, possibly in anticipation of a larger move. 
Shiba Inu Derivatives Data

The open interest-weighted funding rate also remains positive, indicating that long positions are paying to maintain their exposure.

Meanwhile, liquidation data over the past 24 hours showed a relatively balanced distribution. A total of $234.23K was liquidated, split between $114.99K in long positions and $119.25K in shorts. This even split points to a stable market structure with no evident panic or forced selling.

PEPE Eyes Bull Flag Breakout as Open Interest Rebounds to $527M, Near All-Time High

Pepe forms a bullish flag after a 100% rally in early May. With $527 million in open interest and a spike in funding rates, the meme coin targets resistance at $0.000020.

As the crypto market experiences a bullish turnaround, meme coins are regaining momentum. Over the past 24 hours, top meme coins like Dogecoin, Shiba Inu, and Pepe have surged by nearly 5%. Could Pepe’s bullish comeback result in a flag pattern breakout toward the $0.000020 mark?

PEPE Price Analysis

In the 4-hour price chart, Pepe maintained a sideways trajectory between $0.000015 and the upper psychological barrier at $0.00001196. This consolidation phase lasted 11 days and compressed trend momentum.

PEPE Price Chart
PEPE Price Chart

The sideways movement followed a near 100% rally in early May, where PEPE surged from $0.00000761 to $0.000015. This price action completes a classic bull flag formation, with the rally serving as the flagpole and the consolidation phase forming the flag.

Supporting the case for an upside breakout, Pepe’s current recovery is pushing toward the upper boundary. Momentum indicators further reinforce the bullish outlook. The MACD and signal lines remain in positive alignment, while the RSI is trending upward after crossing the midline.

With growing bullish sentiment, technical indicators continue to support an optimistic view for Pepe. According to trend-based Fibonacci levels, a successful flag breakout could target the 78.60% retracement level near $0.000020, with an intermediate resistance around the 50% level at $0.00001657.

On the downside, key support remains at $0.00001196, followed by the psychological level at $0.000010.

Pepe Funding Rate Spike Signals Bullish Sentiment in the Futures Market

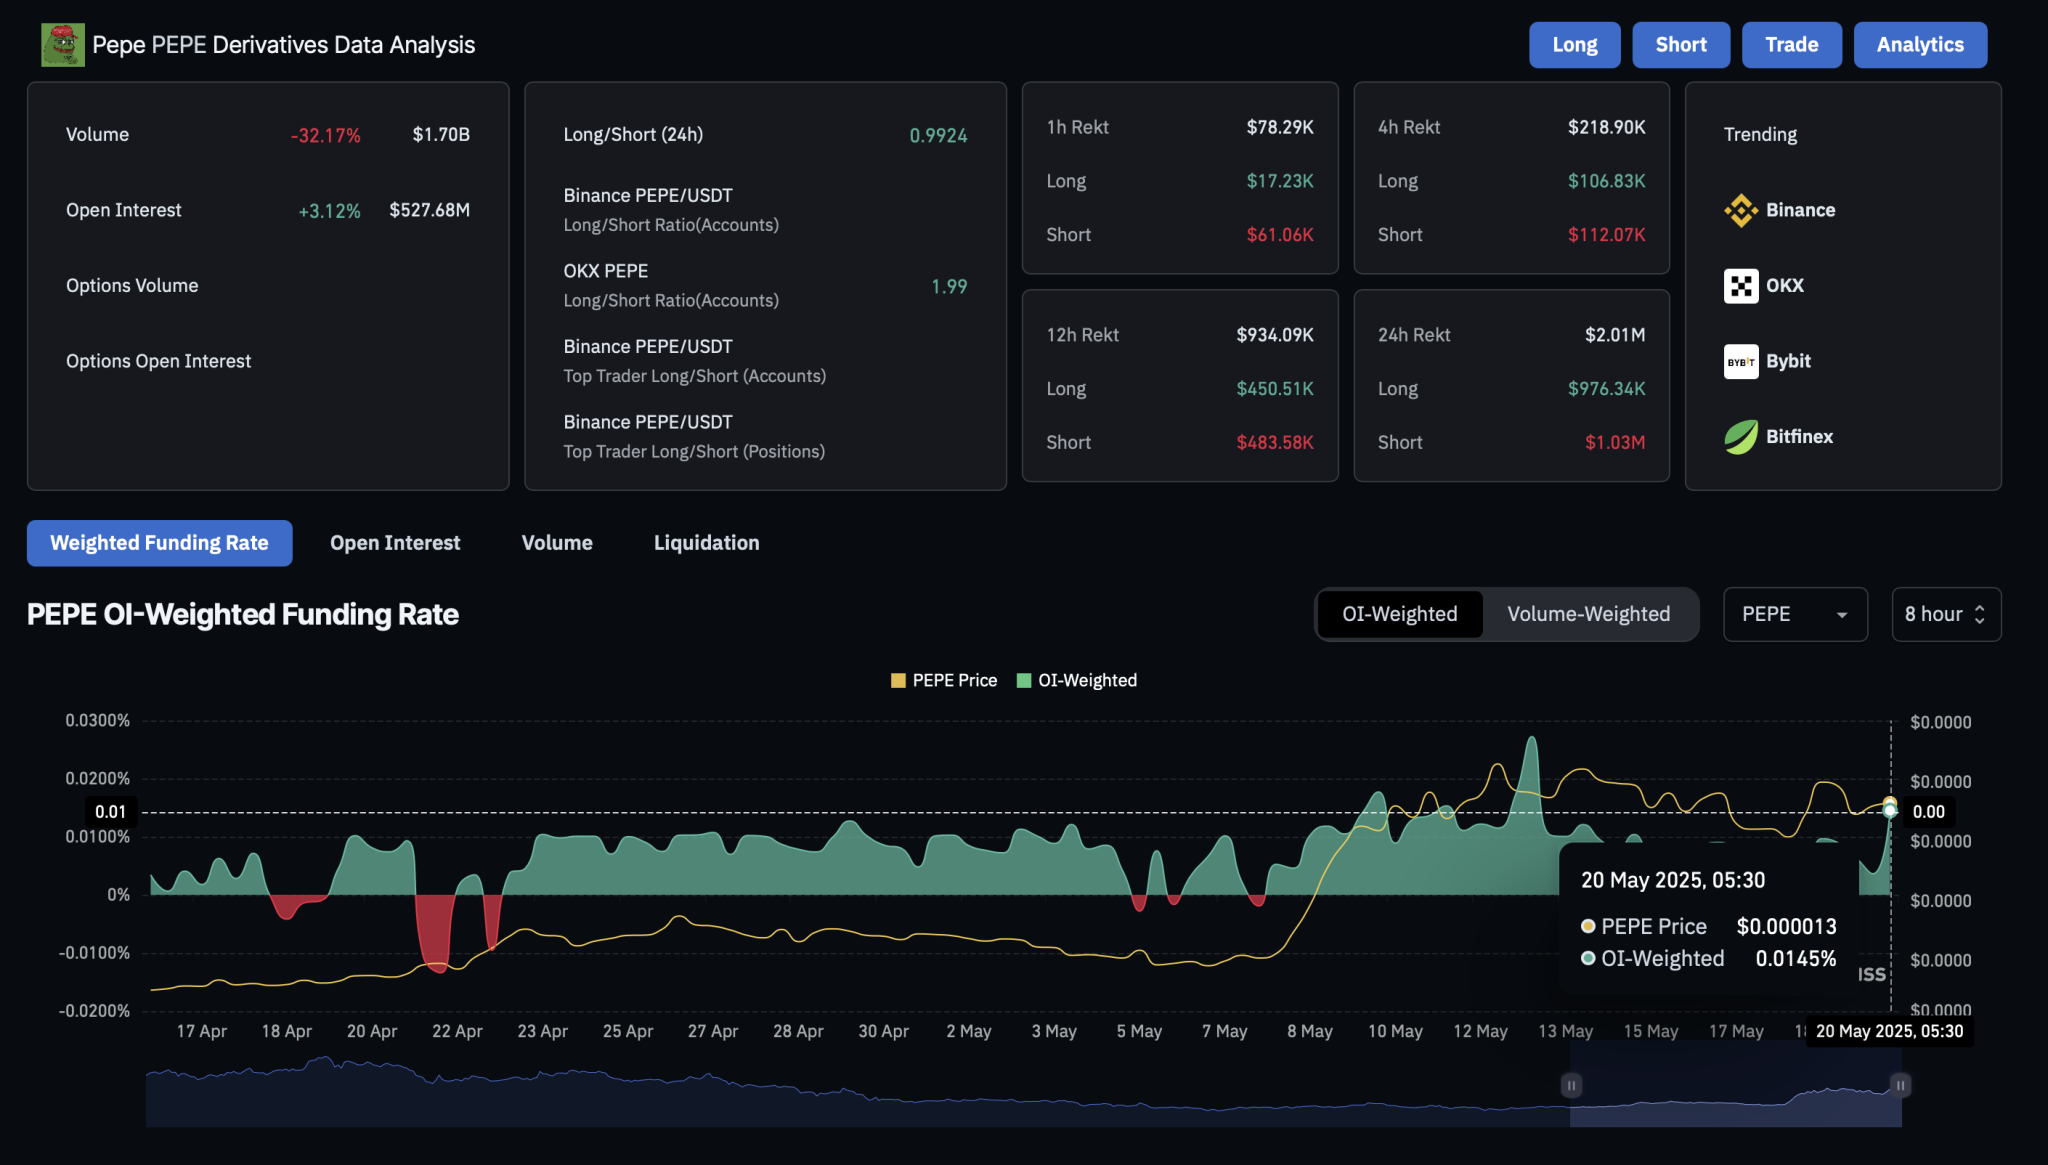
Bullish expectations of a breakout rally are also rising in the PEPE derivatives market. Open interest has increased by 3%, reaching $527 million, close to its all-time high. Meanwhile, short liquidations over the past 24 hours have exceeded $1 million.

Pepe Derivatives
Pepe Derivatives

As of the latest data, the funding rate for PEPE has spiked to 0.0145% following a period of consolidation. This reflects a sharp rise in bullish sentiment and suggests growing anticipation of an upside move, potentially fueled by leveraged positions.

Solana Eyes $215 Amid Record 11.16M Wallets Holding SOL

Solana recovered 2.13% to trade at $170 after a recent pullback. With a falling wedge breakout and 11.16 million wallets holding 0.1 SOL or more, the altcoin is targeting $215.

After pulling back from $185 to $165, Solana shows signs of a potential bullish comeback. It trades at $170, posting an intraday recovery of 2.13%. Could this rebound in SOL spark a breakout rally toward $215?

Solana Price Analysis

On the daily chart, Solana displays a breakout from a falling wedge pattern and is gradually gaining momentum. The breakout rally pushed the price up nearly 50% in just over a month, reaching the 61.80% Fibonacci level at $184.52.

COINBASE:SOLUSD Chart Image by Trojan69420

However, a strong supply zone overlapping with this critical Fibonacci resistance triggered a pullback, resulting in a retest of the 50% Fibonacci level at $165.71.

As Solana holds above this crucial support level, Monday’s intraday recovery, combined with a lower price rejection, suggests a bullish resurgence. That said, momentum indicators show slight weakness in trend strength. The MACD and signal lines have formed a bearish crossover, while the daily RSI has dropped from the overbought zone to around the midpoint.

If the broader market recovery continues, a potential breakout could challenge the 78.60% Fibonacci level at $215. In an optimistic scenario, an extended bull run might even revisit the $261 peak reached in late January.

Conversely, a daily close below $165 would invalidate the bullish outlook and likely lead to a test of the 38.20% Fibonacci level at $148.

Solana Holder Count Hits New All-Time High

Supporting the bullish case, crypto analyst Ali Martinez recently highlighted a sharp increase in Solana wallet holders. In his latest tweet, he noted that the number of wallets holding at least 0.1 SOL has reached a new all-time high of 11.16 million.

Image

With a growing base of investors, Solana’s upward trend appears poised to gain further momentum, raising the likelihood of a breakout rally toward the $215 mark.

Cardano Eyes $0.82 Amid Massive Exchange Outflows and Channel Breakout

Cardano climbs 3% as bullish patterns form on the 4-hour chart. A MACD crossover and a $1B ADA outflow from exchanges hint at a breakout to $0.82.

As Bitcoin scales the $106,000 mark, altcoins are gaining momentum. Cardano is one such token, rising nearly 3% over the past 24 hours. With a bullish turnaround underway, ADA’s price trend suggests a potential channel breakout targeting the $0.82 resistance level.

Cardano Price Analysis

On the 4-hour price chart, Cardano displays a bullish trend, forming higher lows since last month. This has resulted in an ascending trend line connecting the rising low points.

Cardano Price Chart
Cardano Price Chart

In the short term, Cardano’s price trend shows a falling channel pattern as the altcoin declines toward the support trend line. A similar price action occurred in early May, with the formation of a falling wedge. However, a bullish crossover between the MACD and signal lines led to a breakout from that wedge pattern.

Now, with another bounce from within the declining channel, the MACD and signal lines again indicate a positive crossover. This suggests a possible breakout rally as Cardano approaches the overhead trend line.

However, the 4-hour RSI is flat and slightly below the midpoint, reflecting a slowdown in bullish momentum. The doji candle that has formed near the resistance line further confirms this.

As Cardano hovers near the upper boundary, a potential breakout could push the price to $0.82, which aligns with the 50% Fibonacci retracement level. This move would represent a more than 10% upside potential upon breakout.

On the downside, critical support for Cardano remains at $0.725, established on May 19. A close below this level could lead to a test of the lower boundary near the $0.70 psychological mark.

Will a Negative Supply Shock Boost Demand for Cardano?

Supporting the bullish outlook, a recent tweet from TabTools highlighted a massive outflow of Cardano from centralized exchanges. The tweet noted that nearly $1 billion ($932M) worth of ADA was withdrawn from exchanges in 2025, contributing to the bullish momentum toward a potential $3.10 all-time high.

As a significant amount of ADA exits CEXs, a surge in demand could drive the next leg of Cardano’s bull run.

Expert Says Most Will Be Priced Out of XRP Before They Even Notice

XRP commentator Vandell Aljarrah, co-founder of Black Swan Capitalist, has drawn attention to the growing financial divide in the U.S.

He warned that most Americans are unprepared for the next wave of crypto adoption. In a recent tweet, Aljarrah noted that more than 50% of Americans have less than $5,000 in savings. In his view, this financial reality could leave many sidelined as XRP continues to climb.

XRP Surges from Under a Penny to Over $2.30

Reflecting on XRP’s historical growth, Aljarrah reminded followers that the digital asset traded below one cent in 2017. Today, it’s trading above $2.30, showcasing what he describes as a “clear” trajectory that few are paying attention to.

He believes that by the time the broader public becomes aware of XRP’s potential, it will already be out of reach for many, both financially and psychologically. His perspective argues that despite surging by 42,627% from its 2017 low, XRP remains undervalued and has significant upside potential. According to him, those who are invested today are still early.

Priced Out of XRP Before Even Noticing

Notably, in the first quarter of 2017, when XRP traded at $0.0055, someone with $5,000 could have purchased 909,090 XRP tokens. At today’s price of $2.35, that investment would now be worth approximately $2.14 million, assuming the holder never sold.

However, as of today, that same $5,000 would only buy about 2,127 XRP tokens. Given the massive price gap over the past eight years, Aljarrah believes many are being priced out of XRP without even realizing it.

Hoping XRP will continue to rise in value over the next few years, commentators like Aljarrah argue that holding a significant XRP portfolio may soon become unattainable for most people.

Edoardo Farina, founder of Alpha Lions Academy, shares this perspective. In a tweet, he boldly asserted that acquiring even 1,000 XRP tokens could become an impossibility for many in the coming years.

For context, over 5.2 million of the total 6.4 million XRP wallets currently hold 500 XRP tokens or fewer. This highlights how owning 1,000 XRP is already out of reach for the vast majority of holders, even while the price remains at $2.35. Interestingly, many expect the token to reach $100 someday.

Volatility Is Opportunity, Not Risk

Meanwhile, Aljarrah dismissed concerns about XRP’s volatility, calling price fluctuations “a distraction.”

He suggested that volatility is a window of opportunity rather than a risk. This sentiment reflects a broader belief that significant returns often come to those who endure uncertainty.

With institutions exploring XRP’s utility in cross-border settlements, some investors view the current moment as pivotal. They warn that missing out on XRP before widespread adoption could be a historic financial mistake.

Ripple Reportedly Proposes $11B in Cash and XRP to Outbid Coinbase Over Circle Acquisition

0

The quest to acquire Circle has intensified, as Coinbase and Ripple engage in a bidding war to acquire the leading stablecoin issuer. 

Popular business magazine Fortune, citing four sources familiar with the matter, reports that Circle is currently having informal discussions to be sold to either Ripple or Coinbase. 

This latest development follows a Bloomberg report indicating that Ripple offered to buy Circle for $4 billion to $5 billion. However, the USDC stablecoin issuer rejected the offer as “too low.” 

According to private equity and banking sources, Circle is seeking a minimum offer of $5 billion–the same amount it aims to be valued at if it goes public through an IPO as intended. 

Coinbase’s Advantage 

The Fortune report portrays Coinbase as having an advantage over Ripple. One source claimed that Circle might sell itself to Coinbase if the San Francisco-based exchange decides to acquire it. 

This reasoning stems from the relationship between Coinbase and Circle, which led to the launch of the Centre Consortium crypto project in 2018. This project aimed to drive the global adoption of payments stablecoins through USDC. 

Following the conclusion of the venture’s terms in 2023, Coinbase acquired a minority stake in Circle. On the other hand, Circle took over control of the stablecoin’s governance. 

Despite this arrangement, Coinbase and Circle have been sharing revenue from the cash and short-term securities backing USDC. 

Also, Coinbase has a current agreement with Circle that prohibits the latter from forming any partnership that would negatively affect the exchange’s revenue on USDC. According to the agreement, Circle can only enter into such partnerships with Coinbase’s consent. 

Given Coinbase’s close ties with Circle, two sources believe the exchange is well-positioned to acquire Circle if it decides to do so. 

Ripple Aims to Outbid Coinbase Using XRP and Cash

While the acquisition favors Coinbase in multiple ways, one source hinted that Ripple could have a chance to acquire Circle, emphasizing that “things change every week.” 

As previously reported, Ripple first indicated an interest in acquiring Circle by offering around $5 billion, which was rejected as insufficient. With Ripple poised to acquire Circle, Fortune suggests that the payments company might offer some of its XRP holdings alongside cash in subsequent bids. 

According to Ripple’s Q1 2025 Markets Report, the company had 4,562,433,147 (4.56 billion) XRP worth $10.72 billion in its blockchain addresses. It also held another 37,130,000,005 (37.13 billion) XRP valued at $87.25 billion in escrow. 

Angel investor Paul Barron suggested that Ripple has the upper hand over Coinbase in the bid for Circle. He claims that Ripple has raised its offer to around $9 billion to $11 billion in hopes of outbidding Coinbase.

Meanwhile, Coinbase could acquire Circle using its stock and cash. The exchange disclosed a cash holding of $8 billion in Q1 2025. As a public company, it could also raise more funds from investors to complete the deal. 

While Ripple and Coinbase did not explicitly confirm their bid for Circle, the stablecoin issuer denied being available for sale. Circle revealed that it is focused on its long-term goals, which also include going public through an IPO. 

Top Angel Investor and XRP Critic Shares Why He is Now Getting Ready to Buy XRP

Seasoned crypto investor and market analyst Dennis, aka Virtual Bacon, has revealed that he is preparing to buy XRP, a coin he’s long kept at arm’s length.

He shared this updated perspective during a recent live stream. While he has closely tracked XRP since the 2022 bear market, he has never added it to his portfolio. That may soon change.

Meanwhile, Dennis believes XRP still needs to undergo one final shakeout over the next three to six months. He pointed to the hype-driven rally in Q4 2024 and noted that XRP still needs time to settle, allow the hype to fade, and let its fundamentals reestablish, especially as Bitcoin continues to rally and lift the altcoin market.

He believes the final dip could provide an ideal entry point for XRP to move significantly higher.

Ideal Entry Point

The analyst specifically noted that over the past six months, a key pivot level for XRP has been around $2. The price has touched this level multiple times, acting as both strong support and resistance. 

He emphasized that there’s a good chance XRP will dip just below $2, which would mark his ideal entry point. However, Dennis also explained that the main factor for XRP run largely depends on the XRP/BTC ratio.

XRP vs. Bitcoin Must Break Key Level

Since the Q4 rally, Dennis observed that XRP/BTC has formed a rounded top pattern, printing higher highs but with diminishing momentum. The key support level sits around 0.000022 BTC, which has held since November 2024. However, XRP is now approaching that level closely. As of press time, XRP/BTC is at 0.00002231 BTC.

Dennis noted that a break below this level, about a 20–23% drop from current levels, would be his trigger to buy XRP.

Virtual Bacon XRP/BTC chart

He emphasized that these aren’t arbitrary numbers but are based on typical altcoin-to-Bitcoin ratio retracements using Fibonacci levels.

Historical Scenarios

Strengthening his argument, he drew parallels to past market cycles, referencing similar setups in Ethereum and Solana before their major runs.

For example, Solana dropped to its 0.382–0.5 Fibonacci retracement level against BTC before rebounding strongly. Dennis expects XRP to follow a similar path, a move that could bring its USD price just under $1.85 if Bitcoin remains around $100K.

Meanwhile, if Bitcoin rallies further, climbing to $125K and $130K while XRP moves sideways, the XRP/BTC ratio would still fall, also triggering his buy.

In both cases, Dennis believes XRP is undervalued relative to BTC and primed for a rebound, especially as market fundamentals improve.

Why XRP, and Why Now?

As a self-described XRP skeptic, Dennis is now considering a position due to a combination of technical signals, narrative timing, and strengthening fundamentals. The key factors driving his change in stance are XRP’s retail appeal and growing regulatory clarity.

He emphasized that XRP remains a strong “retail coin,” favored by casual investors who often equate lower token prices with affordability and value.

In addition, he noted that XRP’s legal battle with the SEC is essentially resolved, with the asset no longer considered a security. The recent listing of XRP futures on the CME has further added legitimacy.

Dennis also cited Ripple’s rumored bid to acquire Circle and the potential for an XRP spot ETF as additional bullish catalysts. He noted Ripple’s strong cash position, which gives the company room to fuel future growth.

XRP’s Potential Comeback Story

Dennis suggests that XRP’s eventual breakout could lead to renewed interest in similar tokens such as Cardano, Stellar, and HBAR. He compares this potential resurgence to Dogecoin’s revival as the original meme coin, which paved the way for Shiba Inu, PEPE, and others during the 2021 altcoin season.

He sees XRP as a potential standard-bearer for the “payment coin” sector’s comeback.

While Dennis remains skeptical of moonshot predictions like “XRP to $100,” he acknowledges the increasing momentum behind the coin. For now, he’s waiting for a breakdown in the XRP/BTC ratio before making his move.

“Retail hasn’t come back yet,” he said. “But when they do, XRP is usually first in line.”

Shiba Inu in 2050: Here is How Much Holding 100M SHIB Can Turn Out By 2050

0

Investors holding 100 million Shiba Inu tokens today might experience life-changing gains by 2050, when SHIB’s price potentially reaches unprecedented levels. 

Shiba Inu has been shredding most of its recent gains, particularly those acquired last week. While many expected Shiba Inu to push toward $0.00002 after hitting the $0.000017 region the previous week for the first time in several months, its price declined instead.

Over the past seven days, SHIB’s price has slumped by 15.61% to $0.00001405. Similarly, it experienced a drawdown of 4.57% in the past 24 hours. 

Notably, this recent dip is not peculiar to only Shiba Inu, as other major crypto assets, including Cardano, Chainlink, and Sui, have also retraced heavily from where they traded last week. 

Although some investors are troubled by the recent downturn, others have ignored the short-term fluctuations, focusing on the asset’s prospects over the next few years, particularly by 2050. 

Market Expectations By 2050 

A lot is expected to happen in the crypto market between now and 2050. Several analysts anticipate widespread institutional, retail, and government adoption of cryptocurrencies by then. This anticipated adoption could potentially lift crypto prices significantly.

Also, about six more Bitcoin Halving events would have occurred over the next 25 hours. Specifically, these events will happen by 2028, 2032, 2036, 2040, 2044, and 2048. 

It is common knowledge that the crypto market usually embarks on a bull run a few months after each halving event. Therefore, the upcoming ones are expected to follow the same pattern. If this happens, cryptos like Shiba Inu could trade far above their current levels.

Shiba Inu Price Prediction for 2050 

Interestingly, multiple entities have set different 2050 predictions for Shiba Inu. For instance, ChatGPT projected that Shiba Inu could trade between $0.0005 and $0.005 in the next 25 years.

Since SHIB is trading at $0.00001405, hitting the $0.0005 and $0.005 marks demands rallies of 3,458% and 35,487%, respectively.  

However, Grok AI chatbot estimates that SHIB’s price could range from $0.008 to $0.089 by 2050. Hitting the $0.008 target would require a rally of 56,839% from the current price. On the other hand, the ambitious target of $0.089 demands a 633,351% growth. 

Changelly and Telegaon Forecasts 

Moreover, popular prediction platform Telegaon speculates that Shiba Inu would surpass the targets issued by the AI chatbots to a lofty height of $1.06. This prediction requires a rally of 7,544,383% from the current price. 

Further, experts affiliated with Changelly see SHIB trading at $0.0161 by 2050, representing an increase of 114,490% from the current price. 

Value of 100M SHIB Holdings By 2050  

If SHIB reaches any of the aforementioned price targets, early investors with 100 million SHIB could see life-changing gains. At the current price, a blockchain address containing 100 million Shiba Inu tokens is valued at $1,405.

Notably, if SHIB trades at $0.0005 and $0.005, as projected by ChatGPT, a portfolio of 100 million tokens will be valued at $50,000 and $500,000, respectively. Based on Grok AI’s 2050 projection for Shiba Inu, $0.008 to $0.089, this 100 million SHIB portfolio will be valued at $800,000 and $8.9 million. 

According to Changelly’s forecast, a holding of 100 million SHIB tokens could be worth $1.61 million if the price hits $0.0161 by 2050. Lastly, with Telegaon expecting SHIB to trade at $1.06 by 2050, investors who procure 100 million SHIB today could see the value of their investments skyrocket to a whopping $106 million. 

Meanwhile, this analysis is for informational purposes and should not be considered investment advice.

Due to Shiba Inu’s enormous supply of around 589 trillion tokens, there is no guarantee that SHIB will ever reach any of these targets. If this supply remains constant and SHIB hits any ambitious targets, like $1.06, its market cap would soar to $624 trillion.

Notably, Shiba Inu is unlikely to reach a valuation of $624 trillion, as there is not enough money in the world to actualize this.

Binance’s CZ Says the Risk Isn’t Just in Crypto Investing — It’s Also in Staying on the Sidelines

0

While stressing the need for risk management, Binance co-founder CZ has introduced a new narrative stressing the upsides of dabbling with Bitcoin and crypto.

Changpeng Zhao, the co-founder and former CEO of Binance, is bringing a new narrative aboard. While some institutions and market participants find the volatility associated with the crypto sector off-putting, Zhao, popularly known as CZ, thinks it is detrimental not to gain exposure regardless.

CZ Preaches Exposure Regardless

In a Monday tweet, CZ acknowledged that although it is risky to invest in cryptocurrencies, not owning Bitcoin could also be a riskier endeavor. Interestingly, this narrative talks up the theory that with significant risk comes great reward.

The crypto sector has observed bad and good days alike. Some have seen Bitcoin and crypto’s fast-paced price actions as a loophole for investors looking for a mild and conservative means for wealth sustenance and growth.

Further, the industry had just fully recovered from trust-diminishing events following the fallout from Terra, Three Arrows Capital (3AC), and, most recently, FTX. These events had image-tarnishing effects on the industry while stressing the need for clear regulation.

Nonetheless, the sector has grown past that stage, surviving the attacks and mending the trust of many. Also, the market has rallied extensively from the lows to current prices, extensively rewarding those who bought on the downside and held on.

Amid the recovery, which has seen Bitcoin transcend its previous prices, CZ has emphasized that not holding Bitcoin is riskier. Considering the asset’s future trajectory and the benefits of having even a small portion, not considering investing would be a generational fiscal misjudgment.

Meanwhile, while the tweet advocated embracing cryptocurrencies regardless of the narrative, it also acknowledged the hazards associated with the sector. Hence, due diligence and personal research play a major role in staying safe in the industry, as with many other financial markets.

Learn to Manage Risk: CZ

Meanwhile, CZ highlighted a few steps to manage risks while investing in crypto. In a follow-up tweet today, he mentioned three questions one should ask when dabbling in the digital asset business to ensure effective risk management.

First, he emphasized the “risk what you can afford to lose” theory. An important question every prospective crypto investor should ask is what the worst-case scenario would be. Notably, investors should always ask themselves if they are capable of surviving should their investments go to zero.

Secondly, he emphasized another defining question on risk management: how many times can one try while incurring consecutive losses?

Finally, he stressed the importance of learning what you are investing in. CZ noted that it is best to ask oneself if one actually understands what one is doing, as a little knowledge-seeking could change the narrative.

Bitcoin Would Have Proliferated Before Being Deemed Safe

Moreover, Michael Saylor, the executive manager of Strategy (formerly MicroStrategy), recently echoed a similar disposition on the crypto market’s risk.

Saylor, who shares the sentiment that volatility reflects Bitcoin’s utility, insisted that Bitcoin and the crypto market would have reached insane levels before financial advisors start to say it is less risky to invest in or own it.

Specifically, he noted that Bitcoin would hit $1 million before some legal financial institutions deem exposure ok and $10 million before they acknowledge that buying the premier asset is a good idea.

Interestingly, this narrative further stressed the current skepticism around the risks involved with crypto and how it has stood tall regardless. Nonetheless, this paradigm is starting to change as large institutions are beginning to come around.

For context, the $4 trillion asset manager JP Morgan’s CEO Jamie Dimon disclosed yesterday that the company will now allow clients to be exposed to Bitcoin.

Analyst Says Bitcoin Still Keeping it Simple as It Maintains Ascending Channel Above Super Trend Support

0

Analyst IncomeSharks suggests Bitcoin is “keeping it simple,” climbing within a clear ascending channel as bullish momentum holds steady.

Bitcoin has recorded a steady upward trend over the past week, marked by sharp fluctuations but underpinned by sustained bullish momentum. Despite these swings, the general trajectory since May 17 remains positive. 

The current price action shows a sustained yet volatile uptrend, attracting closer analysis from technical and on-chain perspectives.

Technical Indicators Support Ongoing Bullish Momentum

One of the parties involved on May 19 was the analytic account IncomeSharks, which shared a daily chart showing a sustained climb within a clearly defined ascending channel. Since mid-April, the price action has consistently made higher highs and higher lows, showing continued support for the bullish trend. 

Image

Notably, the SuperTrend indicator has played a major role in tracking this progression. Displayed as a green line beneath the price, it sat at $96,240 at the time of IncomeSharks’ post.

The proximity to this SuperTrend value signals a key support level. The market’s reaction in the next 24 to 48 hours could determine whether the current uptrend continues or faces a temporary pullback. 

The same indicator issued a buy signal on April 21, when Bitcoin traded near $96,000. This still acts as a crucial support. It also signaled the beginning of the current upward phase. Before that, in early April, the SuperTrend had flashed a sell signal, which coincided with a brief consolidation period and modest decline.

Meanwhile, the ascending channel has remained intact throughout this period, reflecting a consistent structure. Price movements have respected the boundaries of the channel, offering further confirmation of the ongoing strength in the trend.

The chart implies that Bitcoin is likely to continue climbing, provided it stays within the ascending channel and holds above the SuperTrend support. The visual projection aims for potential upside toward $112,000 to $120,000, assuming the current structure remains valid.

Resilience Without Signs of Overheating

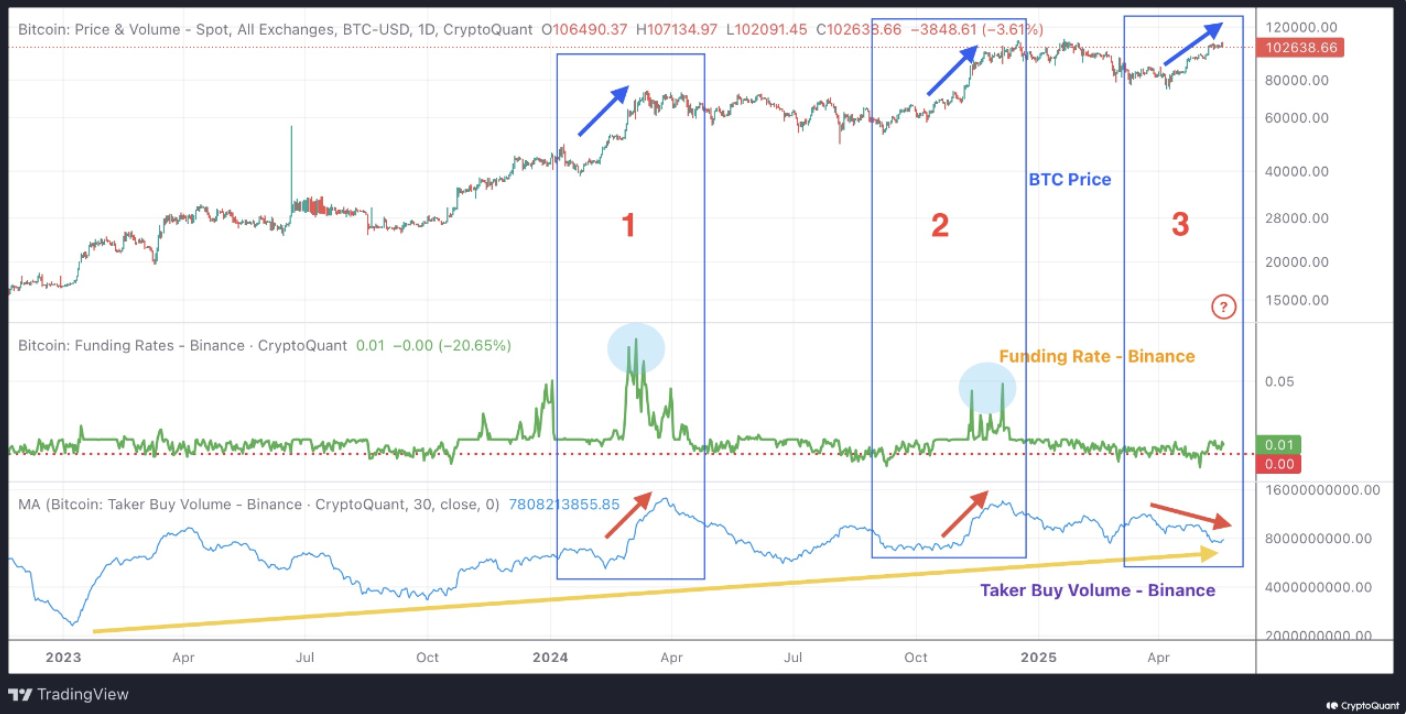
Elsewhere, a CryptoQuant analyst dubbed Avocado has highlighted a key shift in Bitcoin’s recent price recovery. Previous rallies to new all-time highs were marked by a rapid spike in Binance market buy volumes and funding rates. 

These spikes triggered periods of overheating, followed by sharp corrections. According to Avocado’s assessment, this pattern occurred twice during the current cycle and is visible in historical chart boxes labeled 1 and 2.

However, the ongoing rebound diverges from this pattern. Box 3 on the chart shows that funding rates remain low and Binance market buy volumes are trending downward, not upward. 

Image

This development marks a change from prior surges. It suggests that the market is rebounding without the kind of aggressive buying behavior that previously led to overbought conditions and subsequent corrections.

Since 2023, market buy volume has trended steadily upward, despite short-term dips. This ongoing accumulation points to sustained demand.

While some may see the drop in sharp buying activity as a lack of momentum, Avocado interprets the data as indicative of a less leveraged and more structurally sound rally. Sentiment has improved following the rebound, but funding rates and volume patterns imply that traders remain cautious.

This change in behavior from prior rallies may reduce the likelihood of sudden reversals. The absence of overheated conditions supports the view that the market is not currently overextended. 

Bitcoin-Gold Relationship Signals a Potential Continuation

Another analyst has tracked a recurring cyclical relationship between Bitcoin and gold spanning from mid-2024 to May 2025. A comparative chart highlights four distinct phases, during which gold rallies first, followed by Bitcoin. These phases—marked as “Gold Leads” and “Bitcoin Catches Up”—repeat throughout the observed period.

Currently, Bitcoin appears to be in another catch-up phase, trailing gold’s latest move. Historical behavior shows that when this cycle occurs, Bitcoin typically follows with a more aggressive rally. The chart uses shaded zones to illustrate the alternating leadership between the two assets, underscoring the consistency of this pattern.

As of May 2025, both assets continue to climb. This alignment suggests the existing cycle remains intact. The comparative price action hints that Bitcoin may still have room to close the gap with gold, surging to levels above $140,000.

At press time, Bitcoin trades at $105,106, reflecting a 1.9% gain over the past 24 hours, a 2.4% increase over seven days, and an 11.3% rise in the last 14 days.