Fed Neel Kashkati, President of Federal Reserve Bank of Minneapolis, once again irritated the cryptocurrency community by his tweet in which he claimed that the cryptocurrency industry is only populated with Crooks who profit off the uninitiated through their pump-dump schemes.
“Please do point me to the communities being lifted out of poverty due to crypto, other than scammers ripping off unsuspecting people in pump and dump schemes.”
Charles Hoskinson was quick to answer Kashkati. He said:
“So the org that can print TRILLIONS every year and claim there is no inflation thereby devastating the poorest amongst us has an issue with sound money that cannot be manipulated by politics. I’m shocked Neel!! SHOCKED!!!”
So the org that can print TRILLIONS every year and claim there is no inflation thereby devastating the poorest amongst us has an issue with sound money that cannot be manipulated by politics. I'm shocked Neel!! SHOCKED!!! https://t.co/zky65kZ2De
Charles Hoskinson Warns ADA Holders To Be Extremely Vigilant.
Charles Hoskinson, recorded another video in which he warns Cardano holders against scams and misinformation about ADA because of upcoming smart contracts.
Hoskinson claims that ADA giveaway scams are ten times greater than they were a month ago because of the massive ADA rally. He also said that there are many bogus apps in the Google play store.
“If someone is claiming you gonna to get great returns, if someone’s claiming you gonna give them your private keys or send them ADA for whatever reason, they are probably a scam…If you don’t know what to do, feel free to ask a question on cardano.org.”
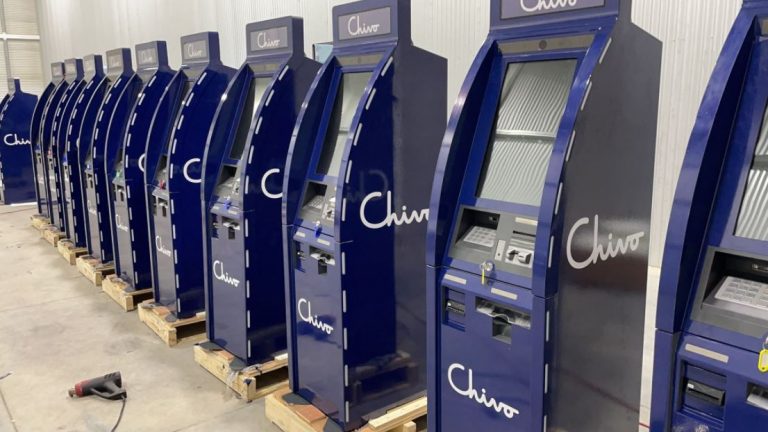
El Salvador stated installing Bitcoin ATMs allowing its citizens to convert Bitcoin into US dollars and withdraw dollars as cash. This new step is a part of the government plan for making the Bitcoin legal tender.
President Nayib Bukele tweeted that 200 ATMs will be installed by the government accompanied by a government official digital wallet, Chivo.
También habrán #CajerosChivo en todas partes y podrán retirar en EFECTIVO, las 24 horas del día y SIN COMISIONES, por más que la oposición diga lo contrario.
El problema para ellos es que podrán convencer a algunas personas de que sí habrán comisiones, pero solo hasta el 7 ? pic.twitter.com/H8gkYTEucc
All transactions will be processed via the government owned Chivo app, and there will be no transaction charges.
To help convert BTC to USD, the government has also set up a fund of $150 million.El Salvador’s Bitcoin law goes into effect on September 7th.All citizens of El Salvador can now download the Chivo Digital wallet.Users will be able to receive $30 worth of free BTC when they sign up.
Bukele stated that the introduction of Bitcoin will save $400 million annually in fees for receiving remittances from abroad.
According to a press release on August 23rd Substack which is a subscription-based online media platform that has over half a billion users has begun accepting Bitcoin Lightning payments in partnership with OpenNode.
Substack, which allows writers to send their work directly to readers, has more than 500,000 paid subscribers,. The top writers are earning over six figures per year.Selected Substack subscribers will be able pay their subscriptions using Bitcoin (BTC) with certain publications allowed to keep their earnings in crypto as well.
The option to pay in Bitcoins is currently only available to publications that are focused on cryptocurrency.Substack has many popular crypto newsletters, but this feature is currently only available for two publications, analyst Willy Woo’s “The Bitcoin Forecast” and Dan Held’s ‘The Held Report.”
Nick Inzucch, Substack product designer, hinted at the possibility that the platform will expand its crypto payment offerings to other writers to allow them more freedom and flexibility.
Nick Inzucchi, product designer at Substack said:
“We’re excited to be working with OpenNode to enable independent publishers on Substack to accept crypto payments, Having this option will give writers more flexibility and freedom, and we look forward to doing more in crypto to meet writers’ needs.”
João Almeida, Co-founder & CTO at OpenNode said:
“Our partnership will allow content creators across the Substack ecosystem to accept Bitcoin payments, and retain earnings in Bitcoin or convert to preferred currency. Writers and podcasters have flocked to Substack to regain creative and financial freedom, and Bitcoin is a natural fit,”
Visa is the latest major company jumping into the NFT craze.
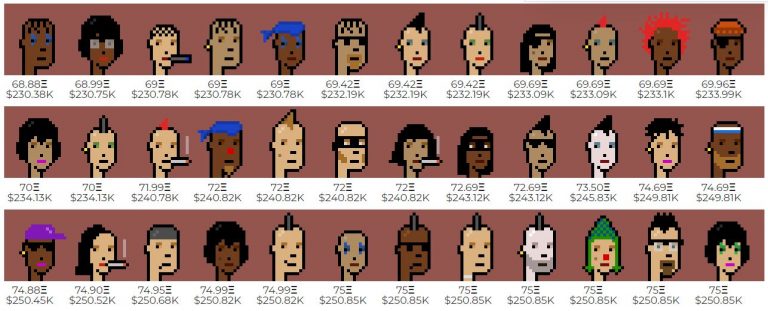
Over the last 60 years, Visa has built a collection of historic commerce artifacts – from early paper credit cards to the zip-zap machine. Today, as we enter a new era of NFT-commerce, Visa welcomes CryptoPunk #7610 to our collection. https://t.co/XoPFfwxUiu
The payments processor said Monday it bought a “CryptoPunk,” one of thousands of NFT-based digital avatars, for nearly $150,000 in ethereum.
An NFT — which stands for non-fungible token — is a unique digital asset designed to represent ownership of a virtual item. Unlike bitcoin and other cryptocurrencies, NFTs can’t be exchanged like-for-like with another NFTs.
Proponents say this makes NFTs scarce, driving up their value. NFTs have often been compared to physical collectible items like rare trading cards and works of art.
“We think NFTs will play an important role in the future of retail, social media, entertainment, and commerce.
We also wanted to signal our support for the creators, collectors, and artists driving the future of NFT-commerce.
Lastly, we wanted to collect an NFT that symbolizes the excitement and opportunity of this particular cultural moment. We’re a company steeped in the history of commerce and payments — but with our eyes on the future. With our CryptoPunk purchase, we’re jumping in feet first. This is just the beginning of our work in this space.”
Binance Singapore today announced Richard Teng appointment as its new Chief Executive Officer (CEO).
Teng has extensive financial industry experience.Teng played a crucial role in making sure that the Abu Dhabi Global Market (ADGM) was internationally recognized by regulators and industry bodies.Forbes calls him “one of the most innovative regulators in the world.”
This announcement comes only a week after Greg Monahan, a former US Treasury Department Crime Investigator, was appointed as the Global Money Laundering Reporting Officer (GMLRO). The move is intended to address Binance ongoing money laundering issues.
After Regulatory issues, Binance stops futures trading for Brazil customers.
Binance has removed its futures trading activities once more for another country. Brazilian clients will no longer have access to Binance derivative trading functions.
To comply with Brazilian regulations, Binance decided to suspend futures trading services from Friday on its Brazilian platform.
Mandatory KYC
Binance has introduces mandatory Know your customer (KYC) policy for all new users.
Binance states that new users must undergo Intermediate KYC verification before they can access Binance services.
Binance claims that the changes are intended to improve user protection and fight financial crime.
“Effective immediately, all new users are required to complete Intermediate Verification to access Binance products and service offerings, including cryptocurrency deposits, trades and withdrawals.”
So, you’ve decided you want to get into the world of trading cryptocurrency. What do you need to do?
First, you need to convert your fiat currency into cryptocurrency. The easiest way to do that is by going to the Buy Crypto page on Binance, where you’ll have a plethora of options. You can buy crypto with debit and credit cards, using your bank account on the P2P exchange, and through third-party solutions like Simplex, Paxful, or Koinax. Once you’re done, you’ll be part of the new financial system!
Now that you’ve got your cryptocurrency, the potential options are abundant. Right away, you can go to the Binance spot exchange and trade coins. If you have previous experience with trading, you could also check out the Binance margin trading platform or Binance Futures. There are also passive income opportunities available, which include staking, lending your assets in Binance Savings, joining the Binance mining pool, and more.
[maxbutton id=”1″ ]
How To Deposit In Binance
How to deposit in Binance (Urdu/Hindi)
[maxbutton id=”1″ ]
How To Withdraw From Binance
Read our step to step complete guide on how to withdraw from Binance Here
How To Trade On Binance
Binance Trading (Hindi/Urdu)
[maxbutton id=”1″ ]
Youtube And Twitter Accounts To Follow To Increase Your Crypto Knowledge
Technical indicators calculate metrics related to a financial instrument. This calculation can be based on price, volume, on-chain data, open interest, social metrics, or even another indicator.
As i have discussed earlier, technical analysts base their methods on the assumption that historical price patterns may dictate future price movements. As such, traders who use technical analysis may use an array of technical indicators to identify potential entry and exit points on a chart.
Technical indicators may be categorized by multiple methods. This can include whether they’re pointing towards future trends (leading indicators), confirming a pattern that’s already underway (lagging indicators), or clarify real-time events (coincident indicators).
Traders may use many different types of technical indicators, and their choice is largely based on their individual trading strategy. However, to be able to make that choice, they needed to learn about them first – and that’s what we’re going to do in this chapter.
Leading vs. lagging indicators
As I have discussed, different indicators will have distinct qualities and should be used for specific purposes. Leading indicators point towards future events. Lagging indicators are used to confirm something that has already happened. So, when should you use them?
Leading indicators are typically useful for short- and mid-term analysis. They are used when analysts anticipate a trend and are looking for statistical tools to back up their hypothesis. Especially when it comes to economics, leading indicators can be particularly useful to predict periods of recession.
When it comes to trading and technical analysis, leading indicators can also be used for their predictive qualities. However, no special indicator can predict the future, so these forecasts should always be taken with a grain of salt.
Lagging indicators are used to confirm events and trends that had already happened, or are already underway. This may seem redundant, but it can be very useful. Lagging indicators can bring certain aspects of the market to the spotlight that otherwise would remain hidden. As such, lagging indicators are typically applied to longer-term chart analysis.
Relative Strength Index (RSI) (VV IMP)
The Relative Strength Index (RSI) is an indicator that illustrates whether an asset is overbought or oversold. It is a momentum oscillator that shows the rate at which price changes happen. This oscillator varies between 0 and 100, and the data is usually displayed on a line chart.
When the RSI value is under 30, the asset may be considered oversold. In contrast, it may be considered overbought when it’s above 70.
The RSI is one of the easiest technical indicators to understand, which makes it one of the best for beginner traders.
How to Use the Relative Strength Index
Beginner Guide to the RSI Indicator
RSI Divergence (VV IMP)
RSI Divergence In Detail
RSI Divergence (In Urdu/Hindi)
Moving Averages (VV IMP)
Moving averages smooth out price action and make it easier to spot market trends. As they’re based on previous price data, they lack predictive qualities. As such, moving averages are considered lagging indicators.
Moving averages have various types – the two most common one is the simple moving average (SMA or MA) and the exponential moving average (EMA).
What’s the difference between them?
The simple moving average is calculated by taking price data from the previous n periods and producing an average. For example, the 10-day SMA takes the average price of the last 10 days and plots the results on a graph.
The exponential moving average is a bit trickier. It uses a different formula that puts a bigger emphasis on more recent price data. As a result, the EMA reacts more quickly to recent events in price action, while the SMA may take more time to catch up.
As I have mentioned, moving averages are lagging indicators. The longer the period they plot, the greater the lag. As such, a 200-day moving average will react slower to unfolding price action than a 100-day moving average.
Moving averages can help you easily identify market trends.
The Most Used Moving Averages are:
7 or 9 MA
25 MA
50 MA
100 MA
200 MA
How To Use The Standard Moving Averages, Beginners Guide
How To Trade Moving Averages (Part 1)
How To Trade Moving Averages (Part 2)
Moving Averages In Detail
Fibonacci Retracement (FIB) (VV IMP)
The Fibonacci Retracement (or Fib Retracement) tool is a popular indicator based on a string of numbers called the Fibonacci sequence. These numbers were identified in the 13th century, by an Italian mathematician called Leonardo Fibonacci.
The Fibonacci numbers are now part of many technical analysis indicators, and the Fib Retracement is among the most popular ones. It uses ratios derived from the Fibonacci numbers as percentages. These percentages are then plotted over a chart, and traders can use them to identify potential support and resistance levels.
These Fibonacci ratios are:
0%
23.6%
38.2%
61.8% (Strong Level)
78.6% (Strong Level)
100%
The main idea behind plotting percentage ratios on a chart is to find areas of interest. Typically, traders will pick two significant price points on a chart, and pin the 0 and 100 values of the Fib Retracement tool to those points. The range outlined between these points may highlight potential entry and exit points, and help determine stop-loss placement.
The Fibonacci Retracement tool is a versatile indicator that can be used in a wide range of trading strategies.
How to Draw Fibonacci Retracement
How To Use The Fibonacci Retracement Tool for Down Trend
Fibonacci Retracement In Urdu/Hindi
Fibonacci Retracement in More Detail (Urdu/Hindi)
Bollinger Bands (BB)
Named after John Bollinger, the Bollinger Bands measure market volatility, and are often used to spot overbought and oversold conditions. This indicator is made up of three lines, or “bands” – an SMA (the middle band), and an upper and lower band. These bands are then placed on a chart, along with the price action. The idea is that as volatility increases or decreases, the distance between these bands will change, expanding and contracting.
Moving Average Convergence Divergence (MACD)
The MACD is an oscillator that uses two moving averages to show the momentum of a market. As it tracks price action that has already occurred, it’s a lagging indicator.
The MACD is made up of two lines – the MACD line and the signal line. How do you calculate them? Well, you get the MACD line by subtracting the 26 EMA from the 12 EMA. Simple enough. Then, you plot this over the MACD line’s 9 EMA – the signal line.
A crossover between the two lines is usually a notable event when it comes to the MACD. If the MACD line crosses above the signal line, that may be interpreted as a bullish signal. In contrast, if the MACD line crosses below the signal, that may be interpreted as a bearish signal.
MACD in detail
Trading Volume
The trading volume may be considered the quintessential indicator. It shows the number of individual units traded for an asset in a given time. It basically shows how much of that asset changed hands during the measured time.
Some consider the trading volume to be the most important technical indicator out there. “Volume precedes price” is a famous saying in the trading world. It suggests that large trading volume can be a leading indicator before a big price move (regardless of the direction).
By using volume in trading, traders can measure the strength of the underlying trend. If high volatility is accompanied by high trading volume, that may be considered a validation of the move. This makes sense because high trading activity should equal a significant volume since many traders and investors are active at that particular price level. However, if volatility isn’t accompanied by high volume, the underlying trend may be considered weak.
NOTE: There are thousands of Technical indicators out there, but you should only use 1 to 3 technical indicators on a chart to avoid getting confused. I personally use RSI, Moving Averages and FIB only.
A long position (or simply long) means buying an asset with the expectation that its value will rise.
Going long on a financial product is the most common way of investing, especially for those just starting out. Long-term trading strategies like buy and hold are based on the assumption that the underlying asset will increase in value. In this sense, buy and hold is simply going long for an extended period of time.
What is shorting?
A short position (or short) means selling an asset with the intention of rebuying it later at a lower price. Shorting is closely related to margin trading, as it may happen with borrowed assets.
When it comes to shorting on the spot markets, it’s quite simple. Let’s say you already have Bitcoin and you expect the price to go down. You sell your BTC for USD, as you plan to rebuy it later at a lower price. In this case, you’re essentially entering a short position on Bitcoin since you’re selling high to rebuy lower. Easy enough. But what about shorting with borrowed funds? Let’s see how that works.
But In margin trading or future trading You borrow an asset that you think will decrease in value – for example, a stock or a cryptocurrency. You immediately sell it. If the trade goes your way and the asset price decreases, you buy back the same amount of the asset that you’ve borrowed. You repay the assets that you’ve borrowed (along with interest) and profit from the difference between the price you initially sold and the price you rebought.
What is the order book?
The order book is a collection of the currently open orders for an asset, organized by price. When you post an order that isn’t filled immediately, it gets added to the order book. It will sit there until it gets filled by another order or canceled.
Order books will differ with each platform, but generally, they’ll contain roughly the same information. You’ll see the number of orders at specific price levels.
When it comes to crypto exchanges and online trading, orders in the order book are matched by a system called the matching engine. This system is what ensures that trades are executed – you could think of it as the brain of the exchange. This system, along with the order book, is core to the concept of electronic exchange.
What is a market order And How to use it?
A market order is an order to buy or sell at the best currently available market price. It’s basically the fastest way to get in or out of a market.
When you’re setting a market order, you’re basically saying: “I’d like to execute this order right now at the best price I can get.”
Your market order will keep filling orders from the order book until the entire order is fully filled.
This is why large traders (or whales) can have a significant impact on the price when they use market orders. A large market order can effectively siphon liquidity from the order book. How so? Let’s go through it when discussing slippage.
What is a limit order And how to set it?
A limit order is an order to buy or sell an asset at a specific price or better. This price is called the limit price. Limit buy orders will execute at the limit price or lower, while limit sell orders will execute at the limit price or higher.
When you’re setting a limit order, you’re basically saying: “I’d like to execute this order at this specific price or better, but never worse.”
Using a limit order allows you to have more control over your entry or exit for a given market. In fact, it guarantees that your order will never fill at a worse price than your desired price.
However, that also comes with a downside. The market may never reach your price, leaving your order unfilled. In many cases, this can mean losing out on a potential trade opportunity.
Deciding when to use a limit order or market order can vary with each trader. Some traders may use only one or the other, while other traders will use both – depending on the circumstances. The important thing is to understand how they work so you can decide for yourself.
What is a stop-loss order and how to place a stoploss? (V V Important To Use Stop Loss)
Now that we know what market and limit orders are, let’s talk about stop-loss orders. A stop-loss order is a type of limit or market order that’s only activated when a certain price is reached. This price is called the stop price.
The purpose of a stop-loss order is mainly to limit losses. Every trade needs to have an invalidation point, which is a price level that you should define in advance. This is the level where you say that your initial idea was wrong, meaning that you should exit the market to prevent further losses. So, the invalidation point is where you would typically put your stop-loss order.
How does a stop-loss order work? As I have mentioned, the stop-loss can be both a limit or a market order. This is why these variants may also be referred to as stop-limit and stop-market orders. The key thing to understand is that the stop-loss only activates when a certain price is reached (the stop price). When the stop price is reached, it activates either a market or a limit order. You basically set the stop price as the trigger for your market or limit order.
Stop loss in Urdu/Hindi
Support And Resistance (V V Important)
Support and resistance are some of the most basic concepts related to trading and technical analysis.
Support means a level where the price finds a “floor.” In other words, a support level is an area of significant demand, where buyers step in and push the price up.
Resistance means a level where the price finds a “ceiling.” A resistance level is an area of significant supply, where sellers step in and push the price down.
What Are Support And resistance?
How To Find Support And Resistance Levels
Support and Resistance In More Detail
Support And Resistance In Hindi
Trend Lines ( VV Important)
Trend lines are a widely used tool by both traders and technical analysts. They are lines that connect certain data points on a chart. Typically, this data is the price.
The main idea behind drawing trend lines is to visualize certain aspects of the price action. This way, traders can identify the overall trend and market structure.
A trading strategy is simply a plan you follow when executing trades. There’s no single correct approach to trading, so each strategy will largely depend on the trader’s profile and preferences.
Regardless of your approach to trading, establishing a plan is crucial – it outlines clear goals and can prevent you from going off course due to emotion. Typically, you’ll want to decide what you’re trading, how you’re going to trade it, and the points at which you’ll enter and exit.
What is day trading?
Day trading is a strategy that involves entering and exiting positions within the same day. The term comes from legacy markets, referencing the fact that they’re only open for set periods during the day. Outside of those periods, day traders are not expected to keep any of their positions open.
Cryptocurrency markets, as you probably know, are not subject to opening or closing times. You can trade around the clock every day of the year. Still, day trading in the context of cryptocurrency tends to refer to a trading style where the trader enters and exits positions within 24 hours.
In day trading, you’ll often rely on technical analysis to determine which assets to trade. Because profits in such a short period can be minimal, you may opt to trade across a wide range of assets to try and maximize your returns. That said, some might exclusively trade the same pair for years.
This style is obviously a very active trading strategy. It can be highly profitable, but it carries with it a significant amount of risk. As such, day trading is generally better suited to experienced traders.
What is swing trading?
Swing trading is a style of trading that attempts to capture short- to medium-term gains in a stock (or any financial instrument) over a period of a few days to several weeks. Swing traders primarily use technical analysis to look for trading opportunities. These traders may utilize fundamental analysis in addition to analyzing price trends and patterns.
Swing trading involves taking trades that last a couple of days up to several months in order to profit from an anticipated price move.
Swing trading exposes a trader to overnight and weekend risk, where the price could gap and open the following session at a substantially different price.
Swing traders can take profits utilizing an established risk/reward ratio based on a stop loss and profit target, or they can take profits or losses based on a technical indicator or price action movements.
Swing Trading In Urdu/Hindi
What is scalping?
Of all of the strategies discussed, scalping takes place across the smallest time frames. Scalpers attempt to game small fluctuations in price, often entering and exiting positions within minutes (or even seconds).
Due to the short time frames, scalping trades often give a small percentage of profits – usually lower than 1%. But scalping is a numbers game, so repeated small profits can add up over time.
Scalping is by no means a beginner’s strategy. An in-depth understanding of the markets, the platforms you’re trading on, and technical analysis are vital to success. That said, for traders that know what they’re doing, identifying the right patterns and taking advantage of short-term fluctuations can be highly profitable.
What is buy and hold?
The “buy and hold” strategy, perhaps unsurprisingly, involves buying and holding an asset. It’s a long-term passive play where investors purchase the asset and then leave it alone, regardless of market conditions. A good example of this in the crypto space is Holding, which typically refers to investors that prefer to buy and hold for years instead of actively trading.
This can be an advantageous approach for those that prefer “hands-off” investing as they don’t need to worry about short-term fluctuations or capital gains taxes. On the other hand, it requires patience on the investor’s part and assumes that the asset won’t end up totally worthless.
What is paper trading?
A paper trade is a simulated trade that allows an investor to practice buying and selling without risking real money. The term dates back to a time when (before the proliferation of online trading platforms) aspiring traders would practice on paper before risking money in live markets.
Paper trading is simulated trading that allows investors to practice buying and selling securities.
Paper trading can test a new investment strategy before employing it in a live account.
Many online brokers offer clients paper trade accounts.
Paper trades teach novices how to navigate platforms and make trades, but may not represent the true emotions that occur during real market condition.